HOT TOPICS LIST
- MACD
- Fibonacci
- RSI
- Gann
- ADXR
- Stochastics
- Volume
- Triangles
- Futures
- Cycles
- Volatility
- ZIGZAG
- MESA
- Retracement
- Aroon
INDICATORS LIST
LIST OF TOPICS
PRINT THIS ARTICLE
by Koos van der Merwe
Putting it all together, I've written a case study of Cardiome Pharma Corp. (COM-T) using a number of my previously explained stock strategies and come up with a "watch me" rating for this stock.
Position: N/A
Koos van der Merwe
Has been a technical analyst since 1969, and has worked as a futures and options trader with First Financial Futures in Johannesburg, South Africa.
PRINT THIS ARTICLE
CUP WITH HANDLE
A "Watch" For Cardiome Pharma Corporation
03/08/04 10:16:12 AMby Koos van der Merwe
Putting it all together, I've written a case study of Cardiome Pharma Corp. (COM-T) using a number of my previously explained stock strategies and come up with a "watch me" rating for this stock.
Position: N/A
| Cardiome Pharma Corp. (COM-T) is a product-focused cardiovascular drug development company. Cardiome has three late stage clinical drug programs focused on atrial arrhythmias, congestive heart failure (CHF), and hyperuricemia (gout). |
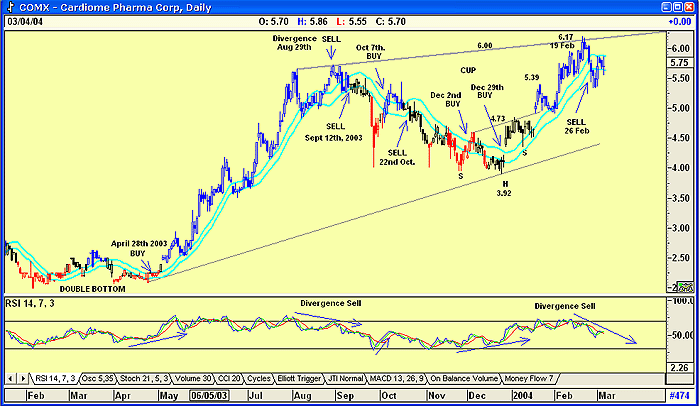
| Looking at the chart you would have bought on April 28, 2003 as the close broke above the upper JM band line. The JM Internal band is a 15-period simple moving average offset by 2% upwards and -2% downwards. A buy signal is given when the price breaks above the upper band and a sell signal is given when it falls below the lower band. In all buy/sell signals given, your preferred indicator must confirm the signal. In the chart I have used a 14-period RSI, and confirmation is there. You would have been drawn to this stock by the double bottom that formed on its chart (see my article, "Using The Double Bottom Strategy, Traders.com Advantage, 2/19/04). |

|
| Cardiome Pharma, a share worth watching. |
| Graphic provided by: AdvancedGET. |
| |
| The chart shows that you would have sold the share on the RSI divergence sell signal given on August 29th, and possibly sold short on September 12th as the price broke below the lower JM band with a downtrending RSI. The V-bottom that formed and the oversold RSI would have closed your short, and because the stock has been good to you, you would have bought it as it broke above the upper JM band line on a rising RSI. You would, however, have been stopped out as the price fell, and could have considered going short on October 22nd, but the uncertainty of the RSI indicators direction may have kept you out. Cautious of the stock, you would not have bought as the price broke above the JM band line on December 2nd, and you would probably have been very tempted to buy on December 29th as the price broke above the upper JM band line with a gap and a strongly rising RSI indicator. You would have also been aware of the developing inverse head and shoulders pattern, and when the neckline was penetrated, once again on a gap, you would have been able to calculate a target of $5.54 (4.73 - 3.92 = 0.81 + 4.73 = 5.54). The price actually paused at $5.39, but being below your target, and with a price level still above the JM band and a rising possibly overbought RSI, you would have held your position, but tightened your stops. You would have looked to the upper resistance line as your target, and been justified by your decision as the price reached $6.17 on February 19th with a divergent RSI sell signal. |
| What now? You could be short as the price broke below the lower JM band line on February 6th, but the new Nasdaq short regulations that will be coming into effect on April 1st worries you, so you stay away. You also notice that a very large cup and handle pattern is unfolding, so you decide to wait. A break above $6.17 on a rising RSI will be a strong buy signal, with a possible target of $9.08 (6.00 - 3.92 = 3.08 + 6.00 = 9.08). I have not shown the target on the screen, as the RSI still has a long way to go before a signal could be given. Other patterns could develop in the meantime, but this is a share that is now on my watch list as a future buy. |
Has been a technical analyst since 1969, and has worked as a futures and options trader with First Financial Futures in Johannesburg, South Africa.
| Address: | 3256 West 24th Ave |
| Vancouver, BC | |
| Phone # for sales: | 6042634214 |
| E-mail address: | petroosp@gmail.com |
Click here for more information about our publications!
Comments
Date: 03/10/04Rank: 5Comment:

Request Information From Our Sponsors
- StockCharts.com, Inc.
- Candle Patterns
- Candlestick Charting Explained
- Intermarket Technical Analysis
- John Murphy on Chart Analysis
- John Murphy's Chart Pattern Recognition
- John Murphy's Market Message
- MurphyExplainsMarketAnalysis-Intermarket Analysis
- MurphyExplainsMarketAnalysis-Visual Analysis
- StockCharts.com
- Technical Analysis of the Financial Markets
- The Visual Investor
- VectorVest, Inc.
- Executive Premier Workshop
- One-Day Options Course
- OptionsPro
- Retirement Income Workshop
- Sure-Fire Trading Systems (VectorVest, Inc.)
- Trading as a Business Workshop
- VectorVest 7 EOD
- VectorVest 7 RealTime/IntraDay
- VectorVest AutoTester
- VectorVest Educational Services
- VectorVest OnLine
- VectorVest Options Analyzer
- VectorVest ProGraphics v6.0
- VectorVest ProTrader 7
- VectorVest RealTime Derby Tool
- VectorVest Simulator
- VectorVest Variator
- VectorVest Watchdog
