HOT TOPICS LIST
- MACD
- Fibonacci
- RSI
- Gann
- ADXR
- Stochastics
- Volume
- Triangles
- Futures
- Cycles
- Volatility
- ZIGZAG
- MESA
- Retracement
- Aroon
INDICATORS LIST
LIST OF TOPICS
PRINT THIS ARTICLE
by Ashwani Gujral
A head and shoulders pattern is a very powerful accumulation and distribution pattern. The Canadian dollar futures are showing just such a distribution pattern, both on the daily and weekly chart. The following weeks are going to be crucial for the Canadian dollar.
Position: N/A
Ashwani Gujral
He is founder of AGIP Securities Pvt. Ltd. which offers money management services, live chat rooms (during market hours) and independent technical analysis consultancy. The company has a big media presence from the likes of CNBC, NDTV Profit, and ZEE Business.
PRINT THIS ARTICLE
HEAD & SHOULDERS
The Canadian Dollar Topping Out
03/08/04 10:07:13 AMby Ashwani Gujral
A head and shoulders pattern is a very powerful accumulation and distribution pattern. The Canadian dollar futures are showing just such a distribution pattern, both on the daily and weekly chart. The following weeks are going to be crucial for the Canadian dollar.
Position: N/A
| Head and shoulder patterns are very visible on charts, occuring as they do when an uptrend or downtrend seems to be stalling out . Towards the end of an uptrend, those bullish on a stock are often retail traders and speculators, while the bears are the institutional investors. If a head and shoulders pattern does not break down in a reasonable period of time, it loses its strength in the breakout/breakdown direction. It can spend itself making an indecisive sideways pattern. In the case of the Canadian dollar, if this bearish pattern breaks down, there could be significant ramifications for the entire commodities bull run, as the Canadian dollar is considered a proxy for direction of commodity prices. Any disruption in its uptrend could potentially end the commodities bull run as well. |
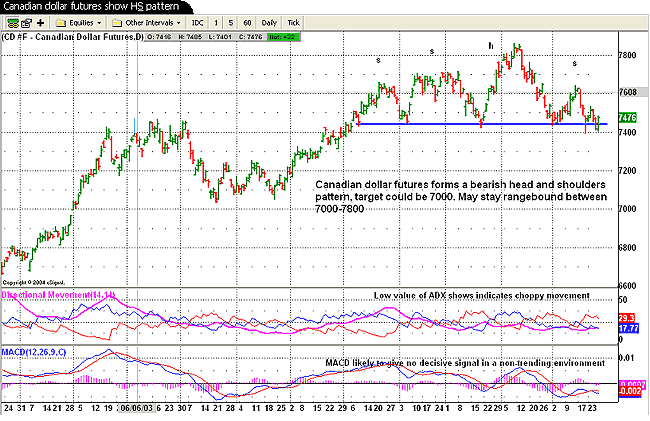
 Figure 1: Daily chart of the Canadian dollar futures. The daily chart above shows a head and shoulders pattern with two left shoulders, one head and one right shoulder. As this pattern almost always forms a symmetrical pattern, it would not be unrealistic to expect another right shoulder formation. The daily ADX remains below 20, which indicates a sideways pattern. In this environment trend following indicators are unlikely to work. The pattern needs to break down with heavy volume for a sustained downtrend. An initial target of 7000 is possible on the daily chart. |

|
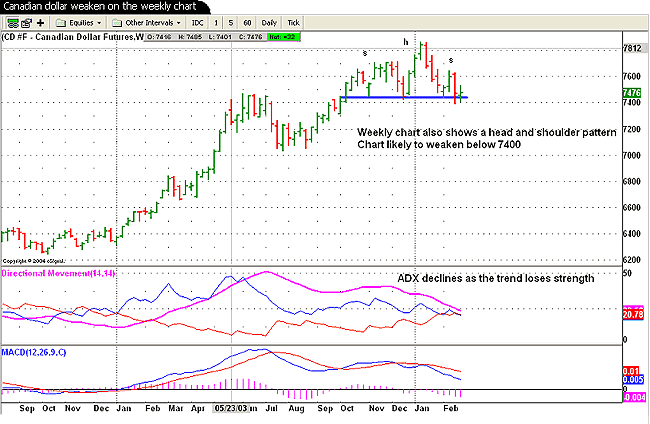
| Figure 2: Weekly chart of the Canadian dollar futures. |
| Graphic provided by: eSignal. |
| |
| On the weekly chart as well, the Canadian dollar futures is losing strength and forming a head and shoulders pattern. ADX has declined to around 20 from substantially higher levels. The MACD has given a sell signal on the weekly chart. A breakdown even here can lead to about 7000 on the Canadian Futures weekly chart. This will also break the bullish trendline to the downside. As of now a good strategy would be to wait for a heavy volume breakdown in both the daily and the weekly chart to take short positions. If that does not happen and the pattern continues to go sideways, stay away. Upside looks like a remote possibility. |
| Bullish and bearish reversal patterns need to break out or break down with heavy volume to confirm trend reversals, otherwise they may continue to move sideways and the pattern itself can break down and lose its ability to predict a trend reversal. My other point is that any trend reversal in the Canadian dollar could be a precursor to a trend reversal in the commodities bull run as well. |
He is founder of AGIP Securities Pvt. Ltd. which offers money management services, live chat rooms (during market hours) and independent technical analysis consultancy. The company has a big media presence from the likes of CNBC, NDTV Profit, and ZEE Business.
| Title: | Chief mkt strategist |
| Company: | AGIP Securities |
| India | |
| Phone # for sales: | 9871066337 |
| Website: | www.ashwanigujral.com |
| E-mail address: | contact@ashwanigujral.com |
Traders' Resource Links | |
| AGIP Securities has not added any product or service information to TRADERS' RESOURCE. | |
Click here for more information about our publications!
Comments
Date: 03/08/04Rank: 5Comment:
Date: 03/09/04Rank: 4Comment:
Date: 03/09/04Rank: 5Comment:

Request Information From Our Sponsors
- StockCharts.com, Inc.
- Candle Patterns
- Candlestick Charting Explained
- Intermarket Technical Analysis
- John Murphy on Chart Analysis
- John Murphy's Chart Pattern Recognition
- John Murphy's Market Message
- MurphyExplainsMarketAnalysis-Intermarket Analysis
- MurphyExplainsMarketAnalysis-Visual Analysis
- StockCharts.com
- Technical Analysis of the Financial Markets
- The Visual Investor
- VectorVest, Inc.
- Executive Premier Workshop
- One-Day Options Course
- OptionsPro
- Retirement Income Workshop
- Sure-Fire Trading Systems (VectorVest, Inc.)
- Trading as a Business Workshop
- VectorVest 7 EOD
- VectorVest 7 RealTime/IntraDay
- VectorVest AutoTester
- VectorVest Educational Services
- VectorVest OnLine
- VectorVest Options Analyzer
- VectorVest ProGraphics v6.0
- VectorVest ProTrader 7
- VectorVest RealTime Derby Tool
- VectorVest Simulator
- VectorVest Variator
- VectorVest Watchdog
