HOT TOPICS LIST
- MACD
- Fibonacci
- RSI
- Gann
- ADXR
- Stochastics
- Volume
- Triangles
- Futures
- Cycles
- Volatility
- ZIGZAG
- MESA
- Retracement
- Aroon
INDICATORS LIST
LIST OF TOPICS
PRINT THIS ARTICLE
by Kevin Hopson
Though some traders may have considered the recent triple top in XTO Energy as being negative, pattern watchers would have recognized the true upside potential of the stock.
Position: Accumulate
Kevin Hopson
Kevin has been a technical analyst for roughly 10 years now. Previously, Kevin owned his own business and acted as a registered investment advisor, specializing in energy. He was also a freelance oil analyst for Orient Trading Co., a commodity futures trading firm in Japan. Kevin is currently a freelance writer.
PRINT THIS ARTICLE
HEAD & SHOULDERS
XTO Energy's Inverse Head And Shoulders Breakout
03/02/04 11:31:05 AMby Kevin Hopson
Though some traders may have considered the recent triple top in XTO Energy as being negative, pattern watchers would have recognized the true upside potential of the stock.
Position: Accumulate
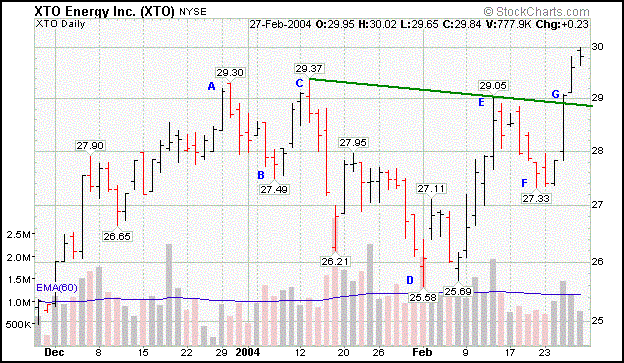
| In late December and early January, XTO Energy (XTO) formed a double top, as the stock stalled out twice in the $29.30 to $29.40 range and then proceeded to pull back by 13 percent. After bottoming out in early February, XTO moved higher, coming close to testing its prior high ($29.37) and appearing to put in a triple top just above the $29.00 level. However, if traders had continued to track the stock during the second half of February, they would have realized that this two-month topping pattern may - in fact - be a bottoming pattern. |
| The stock may have been completing the right shoulder of a two-month inverse head and shoulders pattern. For example, if you look at the three-month chart, you will notice that the A-B-C pattern acted as the left shoulder, the C-D-E as the head, and the E-F-G as the right shoulder. This is upside down (the opposite of a traditional head and shoulders pattern), which is why it is called an inversed head and shoulders pattern. The key to this pattern as nears completion is the neckline, illustrated by the green line in the chart. This line is drawn from the completion point of the left shoulder (pivot C) to the beginning point of the right shoulder (pivot E). Since the neckline is a key price barrier, a break of resistance here would confirm an upside breakout. |

|
| Graphic provided by: Stockcharts.com. |
| |
| XTO broke out of its inverse head and shoulders pattern the last week of February. As a result, the stock could make its way up to the $32.50 level in the near-term. This price target is calculated by taking the vertical distance from the head to the neckline (from pivot D to pivot E) and adding it to the breakout point. When you do this, you get a distance of $3.47 ($29.05 - $25.58) and an estimated price target of roughly $32.50 ($29.00 + $3.47). Since prices tend to test the neckline area after breaking out, I would look for a potential pullback to the $29.00 level in the near-term. This is also the site of the 38.2 percent retracement level from the recent four-day rally. As a result, I recommended accumulating shares of XTO Energy in the near-term and would look to take a full position around the $29.00 level. |
Kevin has been a technical analyst for roughly 10 years now. Previously, Kevin owned his own business and acted as a registered investment advisor, specializing in energy. He was also a freelance oil analyst for Orient Trading Co., a commodity futures trading firm in Japan. Kevin is currently a freelance writer.
| Glen Allen, VA | |
| E-mail address: | hopson_1@yahoo.com |
Click here for more information about our publications!
PRINT THIS ARTICLE

|

Request Information From Our Sponsors
- VectorVest, Inc.
- Executive Premier Workshop
- One-Day Options Course
- OptionsPro
- Retirement Income Workshop
- Sure-Fire Trading Systems (VectorVest, Inc.)
- Trading as a Business Workshop
- VectorVest 7 EOD
- VectorVest 7 RealTime/IntraDay
- VectorVest AutoTester
- VectorVest Educational Services
- VectorVest OnLine
- VectorVest Options Analyzer
- VectorVest ProGraphics v6.0
- VectorVest ProTrader 7
- VectorVest RealTime Derby Tool
- VectorVest Simulator
- VectorVest Variator
- VectorVest Watchdog
- StockCharts.com, Inc.
- Candle Patterns
- Candlestick Charting Explained
- Intermarket Technical Analysis
- John Murphy on Chart Analysis
- John Murphy's Chart Pattern Recognition
- John Murphy's Market Message
- MurphyExplainsMarketAnalysis-Intermarket Analysis
- MurphyExplainsMarketAnalysis-Visual Analysis
- StockCharts.com
- Technical Analysis of the Financial Markets
- The Visual Investor
