HOT TOPICS LIST
- MACD
- Fibonacci
- RSI
- Gann
- ADXR
- Stochastics
- Volume
- Triangles
- Futures
- Cycles
- Volatility
- ZIGZAG
- MESA
- Retracement
- Aroon
INDICATORS LIST
LIST OF TOPICS
PRINT THIS ARTICLE
by Arthur Hill
After a multi-month base, Johnson & Johnson (JNJ) broke resistance and this broken resistance level provided the first key support test.
Position: Buy
Arthur Hill
Arthur Hill is currently editor of TDTrader.com, a website specializing in trading strategies, sector/industry specific breadth stats and overall technical analysis. He passed the Society of Technical Analysts (STA London) diploma exam with distinction is a Certified Financial Technician (CFTe). Prior to TD Trader, he was the Chief Technical Analyst for Stockcharts.com and the main contributor to the ChartSchool.
PRINT THIS ARTICLE
Johnson & Johnson Makes A Major Break
03/01/04 09:06:28 AMby Arthur Hill
After a multi-month base, Johnson & Johnson (JNJ) broke resistance and this broken resistance level provided the first key support test.
Position: Buy
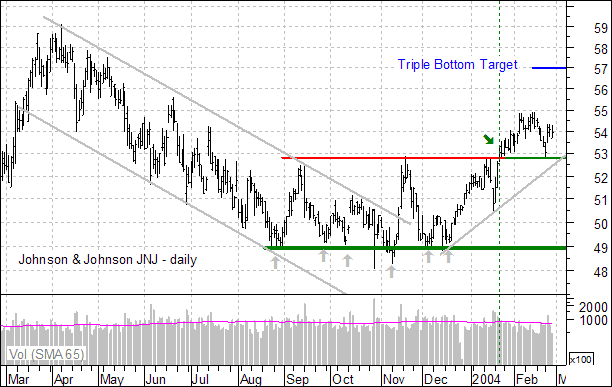
 Figure 1: Daily chart of JNJ. Johnson & Johnson broke triple bottom resistance just below 53 in late January (green arrow). Even though the breakout occurred on only average volume, the price action is still bullish and the upside target is around 57. This is calculated by taking the difference between the upper resistance level and the lower support and adding it to the upper resistance level (53 - 49 = 4, 53 + 4 = 57). |
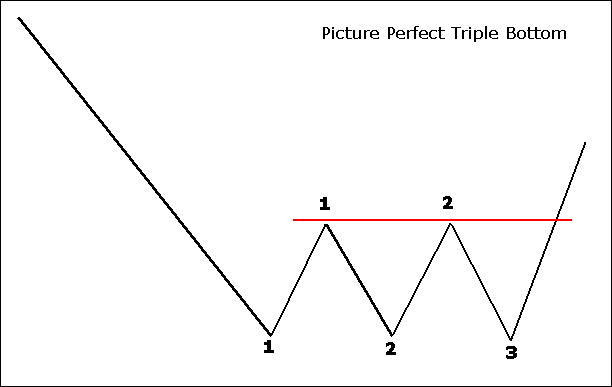
| There are more than three lows around 49 so the pattern is not a "picture perfect" triple bottom with three distinct lows as illustrated in Figure 2. However, technical analysis is a combination of "art" and "science." There is definitely support around 49 with at least six successful tests from August to December. In addition, there are two distinct highs around 53 that marked major resistance. The essence of a triple bottom is clearly visible with a large base (August - December), a well-established resistance level (September and November highs) and a clean break above resistance. |

|
| Figure 2: An example of a triple bottom. |
| Graphic provided by: MetaStock. |
| |
| A key tenet of technical analysis is that broken resistance becomes support. As such, broken resistance at 52.8 became the first support level for JNJ. After a sharp pullback in late February, the stock bounced off broken resistance (turned support) with a gap up and surge in volume (24-Jan). As long as JNJ holds above broken resistance (turned support), the trend is firmly bullish and a move towards 57 is expected. |
Arthur Hill is currently editor of TDTrader.com, a website specializing in trading strategies, sector/industry specific breadth stats and overall technical analysis. He passed the Society of Technical Analysts (STA London) diploma exam with distinction is a Certified Financial Technician (CFTe). Prior to TD Trader, he was the Chief Technical Analyst for Stockcharts.com and the main contributor to the ChartSchool.
| Title: | Editor |
| Company: | TDTrader.com |
| Address: | Willem Geetsstraat 17 |
| Mechelen, B2800 | |
| Phone # for sales: | 3215345465 |
| Website: | www.tdtrader.com |
| E-mail address: | arthurh@tdtrader.com |
Traders' Resource Links | |
| TDTrader.com has not added any product or service information to TRADERS' RESOURCE. | |
Click here for more information about our publications!
PRINT THIS ARTICLE

Request Information From Our Sponsors
- StockCharts.com, Inc.
- Candle Patterns
- Candlestick Charting Explained
- Intermarket Technical Analysis
- John Murphy on Chart Analysis
- John Murphy's Chart Pattern Recognition
- John Murphy's Market Message
- MurphyExplainsMarketAnalysis-Intermarket Analysis
- MurphyExplainsMarketAnalysis-Visual Analysis
- StockCharts.com
- Technical Analysis of the Financial Markets
- The Visual Investor
- VectorVest, Inc.
- Executive Premier Workshop
- One-Day Options Course
- OptionsPro
- Retirement Income Workshop
- Sure-Fire Trading Systems (VectorVest, Inc.)
- Trading as a Business Workshop
- VectorVest 7 EOD
- VectorVest 7 RealTime/IntraDay
- VectorVest AutoTester
- VectorVest Educational Services
- VectorVest OnLine
- VectorVest Options Analyzer
- VectorVest ProGraphics v6.0
- VectorVest ProTrader 7
- VectorVest RealTime Derby Tool
- VectorVest Simulator
- VectorVest Variator
- VectorVest Watchdog
