HOT TOPICS LIST
- MACD
- Fibonacci
- RSI
- Gann
- ADXR
- Stochastics
- Volume
- Triangles
- Futures
- Cycles
- Volatility
- ZIGZAG
- MESA
- Retracement
- Aroon
INDICATORS LIST
LIST OF TOPICS
PRINT THIS ARTICLE
by Matt Blackman
From the slow but steady build in stock price, it appears that something is in the wind. Whether it is the potential launch of a new product or other positive corporate news, this could be an interesting technical play.
Position: N/A
Matt Blackman
Matt Blackman is a full-time technical and financial writer and trader. He produces corporate and financial newsletters, and assists clients in getting published in the mainstream media. He is the host of TradeSystemGuru.com. Matt has earned the Chartered Market Technician (CMT) designation. Find out what stocks and futures Matt is watching on Twitter at www.twitter.com/RatioTrade
PRINT THIS ARTICLE
CHART ANALYSIS
Enzon Pharmaceuticals Bottoming Out?
03/02/04 11:33:39 AMby Matt Blackman
From the slow but steady build in stock price, it appears that something is in the wind. Whether it is the potential launch of a new product or other positive corporate news, this could be an interesting technical play.
Position: N/A
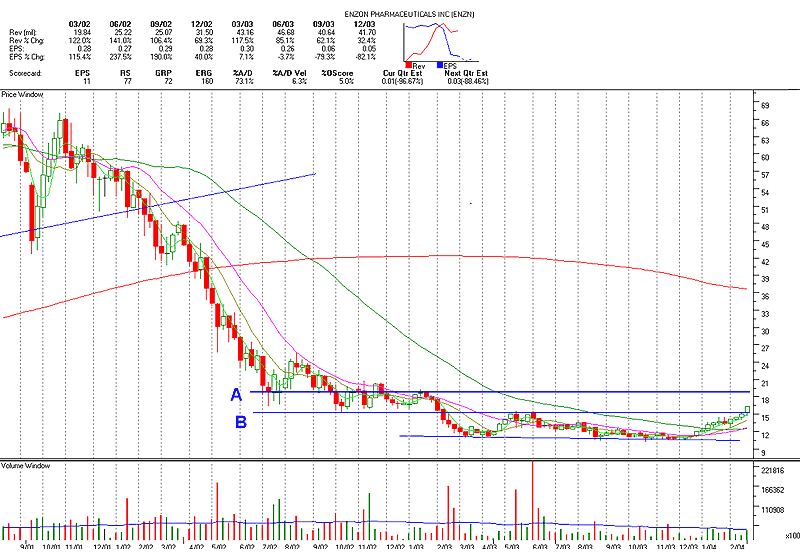
| As a smaller player in the health care biomedical/genetics industry, Enzon Pharmaceuticals (Nasdaq - ENZN) has seen better times. It traded as high as $83 in August 2000 before forming a head and shoulders pattern (which was confirmed in January 2002) and then dropping to trade in the low $10.00 range in October 2003. It has been basing in the last year and began to show new signs of life in early January 2004 after putting in a double bottom pattern. It now looks to be forming a slow but steady saucer pattern, which is bullish. |

|
| Figure 1 – Weekly chart of ENZN showing what looks to be a building saucer pattern and double bottom. Line B shows the recent break above the first threshold of $15.30 with the next target (line A) of $19.15. Chart provided by highgrowthstocks.com |
| |
| Earnings and revenues are recorded in the upper window of Figure 1. |
| Fundamentally, on the plus side, the P/E ratio is a very reasonable 12.36, just 28% of the industry average. The stock has recently been outperforming the market suggesting that something could be in the works in the way of good news. Relative strength of the health care - biomedical industry against the S&P 500 is good and looks like it could be getting ready for a possible breakout in the near future. Corporate insiders own just 0.74% of the shares but institutions hold 85% and have been accumulating shares in the last year. On the negative side, the short interest ratio is currently 8% of float, which is above our 5% threshold for longs, and short interest increased from 3.36 to 3.5 million shares in the last month. Revenues have fluctuated in the last five quarters but earnings remain positive. Free cash flow has been dropping in the last two quarters and was $0.21 in the Sept/03 quarter. This is a sketchy buy based purely on the fundamentals but a good example of a technical buy. The market is telling us that something is afoot based on the chart action and traders look to buy these plays. They will only find out why after the move has occurred but by then most will be out of their positions. With a potential target of $19.15 (line A) and a stop-loss set just below $15.30, at a recent close of around $17.00, the risk/reward is 1.22:1, which is tight, but this could also go a lot higher. |
| SUGGESTED READING: Explanation of High Growth Stocks Charting System http://www.highgrowthstock.com/Demos/default.htm |
Matt Blackman is a full-time technical and financial writer and trader. He produces corporate and financial newsletters, and assists clients in getting published in the mainstream media. He is the host of TradeSystemGuru.com. Matt has earned the Chartered Market Technician (CMT) designation. Find out what stocks and futures Matt is watching on Twitter at www.twitter.com/RatioTrade
| Company: | TradeSystemGuru.com |
| Address: | Box 2589 |
| Garibaldi Highlands, BC Canada | |
| Phone # for sales: | 604-898-9069 |
| Fax: | 604-898-9069 |
| Website: | www.tradesystemguru.com |
| E-mail address: | indextradermb@gmail.com |
Traders' Resource Links | |
| TradeSystemGuru.com has not added any product or service information to TRADERS' RESOURCE. | |
Click here for more information about our publications!
PRINT THIS ARTICLE

Request Information From Our Sponsors
- StockCharts.com, Inc.
- Candle Patterns
- Candlestick Charting Explained
- Intermarket Technical Analysis
- John Murphy on Chart Analysis
- John Murphy's Chart Pattern Recognition
- John Murphy's Market Message
- MurphyExplainsMarketAnalysis-Intermarket Analysis
- MurphyExplainsMarketAnalysis-Visual Analysis
- StockCharts.com
- Technical Analysis of the Financial Markets
- The Visual Investor
- VectorVest, Inc.
- Executive Premier Workshop
- One-Day Options Course
- OptionsPro
- Retirement Income Workshop
- Sure-Fire Trading Systems (VectorVest, Inc.)
- Trading as a Business Workshop
- VectorVest 7 EOD
- VectorVest 7 RealTime/IntraDay
- VectorVest AutoTester
- VectorVest Educational Services
- VectorVest OnLine
- VectorVest Options Analyzer
- VectorVest ProGraphics v6.0
- VectorVest ProTrader 7
- VectorVest RealTime Derby Tool
- VectorVest Simulator
- VectorVest Variator
- VectorVest Watchdog
