HOT TOPICS LIST
- MACD
- Fibonacci
- RSI
- Gann
- ADXR
- Stochastics
- Volume
- Triangles
- Futures
- Cycles
- Volatility
- ZIGZAG
- MESA
- Retracement
- Aroon
INDICATORS LIST
LIST OF TOPICS
PRINT THIS ARTICLE
by Kevin Hopson
The U.S. Dollar Index has temporarily bottomed out but is the recent action indicative of a move higher?
Position: N/A
Kevin Hopson
Kevin has been a technical analyst for roughly 10 years now. Previously, Kevin owned his own business and acted as a registered investment advisor, specializing in energy. He was also a freelance oil analyst for Orient Trading Co., a commodity futures trading firm in Japan. Kevin is currently a freelance writer.
PRINT THIS ARTICLE
CHANNEL LINES
Bullish Or Bearish Pattern For The U.S. Dollar Index?
02/27/04 09:29:15 AMby Kevin Hopson
The U.S. Dollar Index has temporarily bottomed out but is the recent action indicative of a move higher?
Position: N/A
| I have touched on the U.S. Dollar Index ($USD) several times in the past few months. In my initial analysis, I predicted a forthcoming bottom in the index, as bullish divergences on the chart indicated the likelihood of a short-term price reversal. However, once this occurred, I was skeptical whether the index could move significantly higher, the reason being that substantial resistance levels needed to be taken out. Unfortunately, not much has happened since then, making the short-term outlook just as uncertain as before. |
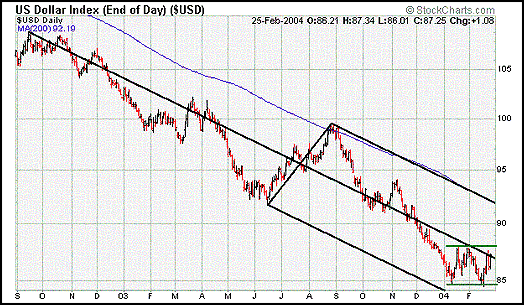
| There are some key price levels that you can watch in the near-term to get a better grasp on where the index might be headed. Looking at an 18-month chart for the index, you will notice that prices have been stuck in a trading range between $85.00 and $88.00 since the beginning of the year. Since trading ranges tend to be continuation patterns and the long-term trend is negative, you would expect an eventual break to the downside. This does not always occur though, as trading ranges sometimes act as topping or bottoming patterns after an extended move in one direction. |

|
| Graphic provided by: Stockcharts.com. |
| |
| As a result, it will be important to watch the $88.00 level. If the index can break its top channel line - as well as the 38.2 percent retracement level ($88.22) from the Nov. '03 to Feb. '04 decline - prices could see a significant break to the upside. On the other hand, a substantial breach of support around the $85.00 level will likely lead to further weakness. Keep in mind that even if the index is able to break to the upside from its current trading range, the longer-term technicals would not turn bullish until the $92.00 level is taken out. This is the site of the top black parallel line, the index's 200-day moving average and the 50 percent retracement level ($92.03) from the Aug. '03 to Feb. '04 decline. |
Kevin has been a technical analyst for roughly 10 years now. Previously, Kevin owned his own business and acted as a registered investment advisor, specializing in energy. He was also a freelance oil analyst for Orient Trading Co., a commodity futures trading firm in Japan. Kevin is currently a freelance writer.
| Glen Allen, VA | |
| E-mail address: | hopson_1@yahoo.com |
Click here for more information about our publications!
Comments
Date: 02/27/04Rank: 5Comment:
Date: 02/29/04Rank: 3Comment:
Date: 03/02/04Rank: 4Comment:

Request Information From Our Sponsors
- StockCharts.com, Inc.
- Candle Patterns
- Candlestick Charting Explained
- Intermarket Technical Analysis
- John Murphy on Chart Analysis
- John Murphy's Chart Pattern Recognition
- John Murphy's Market Message
- MurphyExplainsMarketAnalysis-Intermarket Analysis
- MurphyExplainsMarketAnalysis-Visual Analysis
- StockCharts.com
- Technical Analysis of the Financial Markets
- The Visual Investor
- VectorVest, Inc.
- Executive Premier Workshop
- One-Day Options Course
- OptionsPro
- Retirement Income Workshop
- Sure-Fire Trading Systems (VectorVest, Inc.)
- Trading as a Business Workshop
- VectorVest 7 EOD
- VectorVest 7 RealTime/IntraDay
- VectorVest AutoTester
- VectorVest Educational Services
- VectorVest OnLine
- VectorVest Options Analyzer
- VectorVest ProGraphics v6.0
- VectorVest ProTrader 7
- VectorVest RealTime Derby Tool
- VectorVest Simulator
- VectorVest Variator
- VectorVest Watchdog
