HOT TOPICS LIST
- MACD
- Fibonacci
- RSI
- Gann
- ADXR
- Stochastics
- Volume
- Triangles
- Futures
- Cycles
- Volatility
- ZIGZAG
- MESA
- Retracement
- Aroon
INDICATORS LIST
LIST OF TOPICS
PRINT THIS ARTICLE
by Koos van der Merwe
It can be advantageous to combine various trading strategies. I often use the "Double Bottom" strategy to identify a possible stock set up, and then combine it with the JM trading band strategy to get confirming entry and exit points.
Position: Accumulate
Koos van der Merwe
Has been a technical analyst since 1969, and has worked as a futures and options trader with First Financial Futures in Johannesburg, South Africa.
PRINT THIS ARTICLE
MOVING AVERAGES
A Possible Future Buy For Cisco Systems?
03/01/04 09:42:21 AMby Koos van der Merwe
It can be advantageous to combine various trading strategies. I often use the "Double Bottom" strategy to identify a possible stock set up, and then combine it with the JM trading band strategy to get confirming entry and exit points.
Position: Accumulate
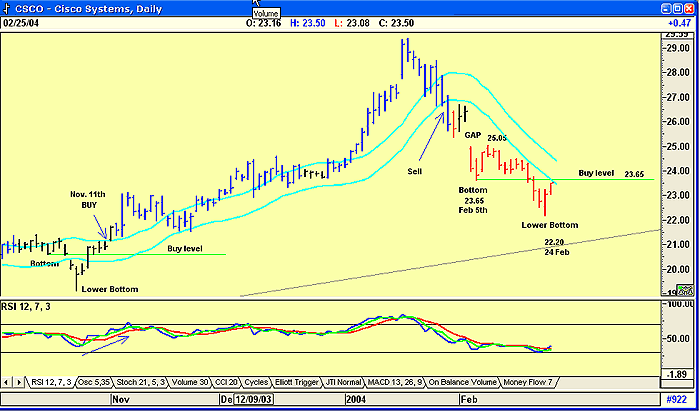
| The chart below of Cisco (CSCO) shows a low reached on February 5th at $23.65. The price then rose to $25.05 in an attempt to fill the gap before falling to a lower bottom of $22.20 on February 24th. This immediately triggered a "watch me" signal on the Double Bottom strategy (see "Using The Double Bottom Strategy, Traders.com Advantage, 2/19/04 for an explanation of the strategy). Should the price break above the previous low of $23.65 plus 50% of the previous day's trading range, it would give a buy signal. |
| Applying this to Cisco, the trading range for February 25th was: High - low = range. This figure was $0.42. I will now add half this range, $0.21, to the open of the 26th. Should the price rise above this level, I will consider buying. |

|
| A possible future buy for Cisco. |
| Graphic provided by: AdvancedGET. |
| |
| How successful is this strategy? If you look back to October 2003 on the chart, you will see that the price formed a low, then a lower low after a pullback, followed by a rise above the target level, suggesting a possible buy. On the chart, I have shown the buy as a break above the upper JM band on a rising RSI indicator, thus confirming the double bottom buy. |
| A JM trading band is a 15-period moving average offset by 2% positive and -2% negative. A move above the upper trading band signals a buy signal. |
| Combining the two strategies can give a very definite advantage -- any break upwards in the double bottom strategy can forewarn of a future buy signal in the more conservative JM strategy. |
Has been a technical analyst since 1969, and has worked as a futures and options trader with First Financial Futures in Johannesburg, South Africa.
| Address: | 3256 West 24th Ave |
| Vancouver, BC | |
| Phone # for sales: | 6042634214 |
| E-mail address: | petroosp@gmail.com |
Click here for more information about our publications!
Comments
Date: 03/02/04Rank: 5Comment: Took a position in CSCO a couple of weeks ago so very timely for me. However I m unfamiliar with the JM band and will have to research that, the article does not give enough info. live4wind@hotmail.com

Request Information From Our Sponsors
- StockCharts.com, Inc.
- Candle Patterns
- Candlestick Charting Explained
- Intermarket Technical Analysis
- John Murphy on Chart Analysis
- John Murphy's Chart Pattern Recognition
- John Murphy's Market Message
- MurphyExplainsMarketAnalysis-Intermarket Analysis
- MurphyExplainsMarketAnalysis-Visual Analysis
- StockCharts.com
- Technical Analysis of the Financial Markets
- The Visual Investor
- VectorVest, Inc.
- Executive Premier Workshop
- One-Day Options Course
- OptionsPro
- Retirement Income Workshop
- Sure-Fire Trading Systems (VectorVest, Inc.)
- Trading as a Business Workshop
- VectorVest 7 EOD
- VectorVest 7 RealTime/IntraDay
- VectorVest AutoTester
- VectorVest Educational Services
- VectorVest OnLine
- VectorVest Options Analyzer
- VectorVest ProGraphics v6.0
- VectorVest ProTrader 7
- VectorVest RealTime Derby Tool
- VectorVest Simulator
- VectorVest Variator
- VectorVest Watchdog
