HOT TOPICS LIST
- MACD
- Fibonacci
- RSI
- Gann
- ADXR
- Stochastics
- Volume
- Triangles
- Futures
- Cycles
- Volatility
- ZIGZAG
- MESA
- Retracement
- Aroon
INDICATORS LIST
LIST OF TOPICS
PRINT THIS ARTICLE
by David Penn
When a pattern breaks down, standing aside is one option. Taking the other side is another.
Position: N/A
David Penn
Technical Writer for Technical Analysis of STOCKS & COMMODITIES magazine, Working-Money.com, and Traders.com Advantage.
PRINT THIS ARTICLE
HEAD & SHOULDERS
The Nasdaq's Failed Head And Shoulders Bottom
02/26/04 01:38:27 PMby David Penn
When a pattern breaks down, standing aside is one option. Taking the other side is another.
Position: N/A
| A famous trader once suggested that one of the hardest things for market participants to do was not to "get out" when a trade was going against them, but was to take the trade in the other direction. This is hard for a number of reasons -- and some of them probably good ones. Interviews with traders are filled with accounts of inexperienced traders buying too high, then trying to correct that buy by selling short when the tradable topped out, then buying again when the correction proved to be too shallow, and then, and then, and so on and so on. . . |
| But there may be instances when a bullish projection goes wrong that point to an opportunity to either recoup losses or to start a new trade off right. I would suspect that many of these instances revolve around trying to find tops and bottoms in a market. By definition, if a trader's analysis suggests that a stock or commodity or currency is bottoming and, rather than break out to the upside, that tradable's breakout is aborted and its price begins falling, then it is likely that the analysis was wrong and that, rather than ending the prevailing trend, the prevailing trend has reasserted itself. |

|
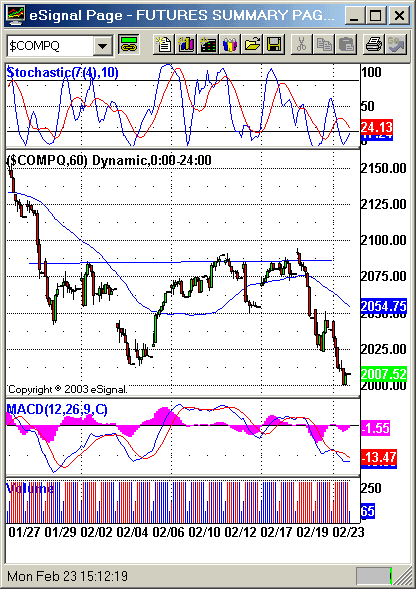
| Figure 1: This head and shoulders bottom in the hourly Nasdaq looked perfect -- until it looked terrible. |
| Graphic provided by: eSignal. |
| |
| I was looking at an hourly chart of the Nasdaq several days ago when I noticed what appeared to be a head and shoulders bottom developing between the end of January and mid-February. I was open to the development of such a chart pattern because I believed the Nasdaq to be in a bull market and, thus, am trying to be especially mindful of bottoming patterns in intraday charts, patterns that might highlight an entry opportunity on the long side. |
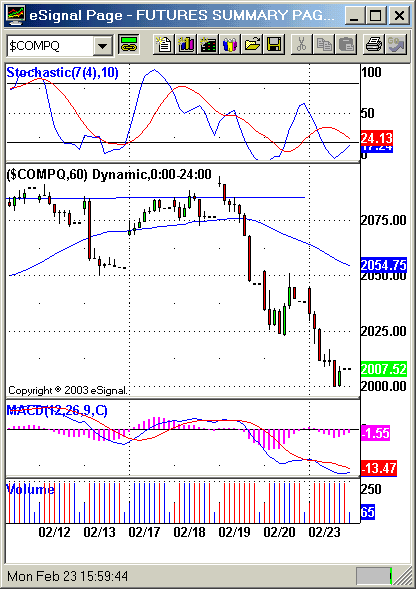
 Figure 2: When prices reversed sharply--after gapping up on the prospective breakout--it was a signal that the pattern might be failing. I don't think I was the only one looking at this head and shoulders bottom, either. Note how, as the Nasdaq is nearing a breakout on the right side of the formation (right shoulder) from about February 11th to February 18th, the hourly chart shows a sharp gap up early on February 19th. Following this move, the Nasdaq reverses direction and falls for six straight hours over the balance of the day. There are two ways a chart pattern can tell a trader that the anticipated breakout might not materialize: a lackluster breakout (often the case with diamond patterns and triangles, it seems), and the second is a sharp pullback at precisely the moment when the bulls (in this case) should have been showing their strength. |
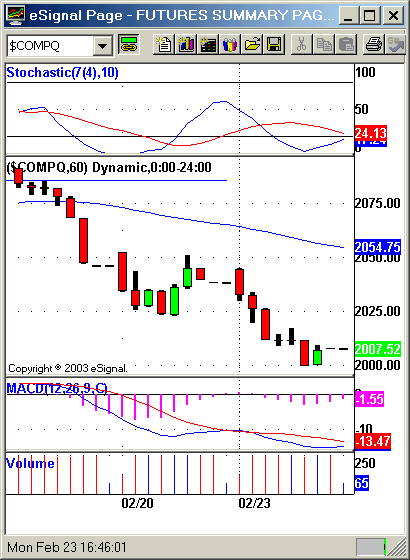
| If a trader didn't bail out of any hopes for an upside breakout in the hourly Nasdaq when prices smashed down below the 50-bar EMA, then they almost certainly would have by the end of Thursday, February 19th. Those traders who hung around hoping for the H&S bottom to be valid (the pre-failure upside projection was significant indeed, calling for a move to 2162 or higher given a breakout at 2088) found bitter reward for their optimism on Friday, as the Nasdaq opened with pain, a brief two-hour respite, and more pain. I don't mean to suggest that traders should have taken the bearish side of this trade when the breakout aborted. The methodology I follow, a combination of the MACD histogram, the 7/10 stochastic, candlesticks and the 50-bar EMA, did not provide a sell signal when the head and shoulders bottom did not break out meaningfully to the upside. By the time the pattern reversed, the stochastic was already deeply oversold -- just one among many factors that explained why the methodology I follow would not have issued a "sell" on February 19th. That didn't preclude taking a position on the short side; it is just to say that one methodology wouldn't have provided a signal -- at least not at that point.  Figure 3: The sell opportunity came not during the Nasdaq's initial collapse, but at the eve of its second. The bounce on February 20th, however, was a horse of a different color. While the market wasn't exceptionally overbought and the MACD histogram was only marginally positive, the fact that this was happening (a) below the 50-bar EMA and, (b) in the context of the initial severe break on February 19th, allowed for selling the Nasdaq at these already-depressed levels. Specifically, the above-mentioned methodology would have allowed for a short early on February 23rd below about 2019. |
Technical Writer for Technical Analysis of STOCKS & COMMODITIES magazine, Working-Money.com, and Traders.com Advantage.
| Title: | Technical Writer |
| Company: | Technical Analysis, Inc. |
| Address: | 4757 California Avenue SW |
| Seattle, WA 98116 | |
| Phone # for sales: | 206 938 0570 |
| Fax: | 206 938 1307 |
| Website: | www.Traders.com |
| E-mail address: | DPenn@traders.com |
Traders' Resource Links | |
| Charting the Stock Market: The Wyckoff Method -- Books | |
| Working-Money.com -- Online Trading Services | |
| Traders.com Advantage -- Online Trading Services | |
| Technical Analysis of Stocks & Commodities -- Publications and Newsletters | |
| Working Money, at Working-Money.com -- Publications and Newsletters | |
| Traders.com Advantage -- Publications and Newsletters | |
| Professional Traders Starter Kit -- Software | |
Click here for more information about our publications!
Comments
Date: 03/02/04Rank: 3Comment:

Request Information From Our Sponsors
- StockCharts.com, Inc.
- Candle Patterns
- Candlestick Charting Explained
- Intermarket Technical Analysis
- John Murphy on Chart Analysis
- John Murphy's Chart Pattern Recognition
- John Murphy's Market Message
- MurphyExplainsMarketAnalysis-Intermarket Analysis
- MurphyExplainsMarketAnalysis-Visual Analysis
- StockCharts.com
- Technical Analysis of the Financial Markets
- The Visual Investor
- VectorVest, Inc.
- Executive Premier Workshop
- One-Day Options Course
- OptionsPro
- Retirement Income Workshop
- Sure-Fire Trading Systems (VectorVest, Inc.)
- Trading as a Business Workshop
- VectorVest 7 EOD
- VectorVest 7 RealTime/IntraDay
- VectorVest AutoTester
- VectorVest Educational Services
- VectorVest OnLine
- VectorVest Options Analyzer
- VectorVest ProGraphics v6.0
- VectorVest ProTrader 7
- VectorVest RealTime Derby Tool
- VectorVest Simulator
- VectorVest Variator
- VectorVest Watchdog
