HOT TOPICS LIST
- MACD
- Fibonacci
- RSI
- Gann
- ADXR
- Stochastics
- Volume
- Triangles
- Futures
- Cycles
- Volatility
- ZIGZAG
- MESA
- Retracement
- Aroon
INDICATORS LIST
LIST OF TOPICS
PRINT THIS ARTICLE
by Gary Grosschadl
Nortel has almost doubled in the last three months. After such a dramatic rise what are the downside and upside probabilities?
Position: Hold
Gary Grosschadl
Independent Canadian equities trader and technical analyst based in Peterborough
Ontario, Canada.
PRINT THIS ARTICLE
CHART ANALYSIS
Nortel Network's Longer-Term View
02/27/04 10:56:20 AMby Gary Grosschadl
Nortel has almost doubled in the last three months. After such a dramatic rise what are the downside and upside probabilities?
Position: Hold
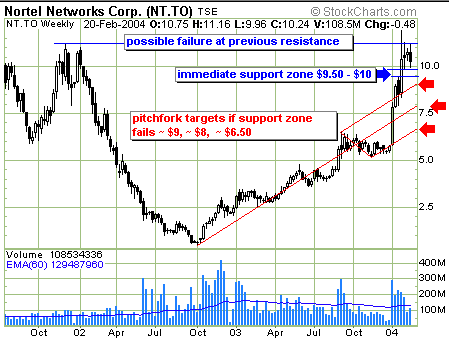
| This weekly chart shows a dramatic comeback from the .80 range back in October 2002. The other very noticeable characteristic is that the stock's rise balked at previous resistance, demonstrating how stock behavior has a memory of its previous support and resistance. |
| A pitchfork was drawn to put this very powerful move in perspective. A hallmark of pitchfork analysis is a move from the lower median line often makes it to the center median line. It takes a super bull move for the stock to go further to hit the upper median line -- something not seen that often. Here is something rare indeed, a move blasting through both median lines and then using the uppermost line as a further launching pad to higher highs. After a move like that, any stock earns a rest or is due for some consolidation. |

|
| Weekly chart showing Nortel's dramatic price moves. |
| Graphic provided by: Stockcharts.com. |
| |
| For now Nortel appears to be consolidating on this weekly chart in a rectangular range of $10 - $11.25. A break either way out of this range will likely be the bigger trading signal for the patient trader working in longer time frames. |
| A break above the range will likely test the previous high of $11.94. A bold move past this level would bring a higher target of $12.64, this being the 200-period exponential moving average on a multi-year chart. A move below $10 brings a test of mid-candlestick support of $9.50 so a support zone of $9.50 - $10 is suggested. If this zone fails, then support could be found at any of the previous pitchfork median lines depending on the severity of the decline. |
| The next major move for Nortel could be a substantial one -- but will it be up or down? Watch for a break either way and the likely cataylst could well be major news and or a solid move up or down for the Nasdaq index. |
Independent Canadian equities trader and technical analyst based in Peterborough
Ontario, Canada.
| Website: | www.whatsonsale.ca/financial.html |
| E-mail address: | gwg7@sympatico.ca |
Click here for more information about our publications!
Comments
Date: 02/29/04Rank: 5Comment:
Date: 03/02/04Rank: 4Comment:

Request Information From Our Sponsors
- StockCharts.com, Inc.
- Candle Patterns
- Candlestick Charting Explained
- Intermarket Technical Analysis
- John Murphy on Chart Analysis
- John Murphy's Chart Pattern Recognition
- John Murphy's Market Message
- MurphyExplainsMarketAnalysis-Intermarket Analysis
- MurphyExplainsMarketAnalysis-Visual Analysis
- StockCharts.com
- Technical Analysis of the Financial Markets
- The Visual Investor
- VectorVest, Inc.
- Executive Premier Workshop
- One-Day Options Course
- OptionsPro
- Retirement Income Workshop
- Sure-Fire Trading Systems (VectorVest, Inc.)
- Trading as a Business Workshop
- VectorVest 7 EOD
- VectorVest 7 RealTime/IntraDay
- VectorVest AutoTester
- VectorVest Educational Services
- VectorVest OnLine
- VectorVest Options Analyzer
- VectorVest ProGraphics v6.0
- VectorVest ProTrader 7
- VectorVest RealTime Derby Tool
- VectorVest Simulator
- VectorVest Variator
- VectorVest Watchdog
