HOT TOPICS LIST
- MACD
- Fibonacci
- RSI
- Gann
- ADXR
- Stochastics
- Volume
- Triangles
- Futures
- Cycles
- Volatility
- ZIGZAG
- MESA
- Retracement
- Aroon
INDICATORS LIST
LIST OF TOPICS
PRINT THIS ARTICLE
by Ashwani Gujral
The head and shoulders formation is the most intuitive bottoming or topping out pattern. In it, the weaker of the bulls and bears prior to the pattern wins the post-pattern battle. On the strength of this pattern Kellogg Inc. is set to touch $43 in the medium-term.
Position: Buy
Ashwani Gujral
He is founder of AGIP Securities Pvt. Ltd. which offers money management services, live chat rooms (during market hours) and independent technical analysis consultancy. The company has a big media presence from the likes of CNBC, NDTV Profit, and ZEE Business.
PRINT THIS ARTICLE
HEAD & SHOULDERS
Kellogg Co. Shows A Head And Shoulders Bottom
02/27/04 10:53:32 AMby Ashwani Gujral
The head and shoulders formation is the most intuitive bottoming or topping out pattern. In it, the weaker of the bulls and bears prior to the pattern wins the post-pattern battle. On the strength of this pattern Kellogg Inc. is set to touch $43 in the medium-term.
Position: Buy
| A head and shoulders pattern occurs when a higher top and bottom (head), occurs in the middle of a series of tops and bottoms (shoulders). There can be a single set of shoulders, made up of the minimum three tops and bottoms, or multiple shoulders can be set between the head. Since the market is made of millions of traders, both institutional and retail, it takes a certain amount of time and trading at a certain level to turn opinion. Usually a head and shoulders pattern is the point where retail investors act as guinea pigs. At the tops, institutional investors keep the prices pulled up to a certain level, distributing all their holdings to the retail investors. At bottoms, when the retail trader is running scared, institutional investors buy their stock at dirt cheap prices. |
| A simple head and shoulders bottoming pattern, shown on the chart below, consists of one bottom with high volume (first shoulder), a second lower bottom (head) with lower volume, and then a third higher bottom (second shoulder), and then a rally back through the neckline at very high volume. Other characteristics of a head and shoulders pattern are: 1. The second shoulder is higher than the first shoulder. 2. The head is the stage where oscillators start showing positive divergences. Even though the price has made a lower low, the momentum of the downmove has slowed. 3. Low volume rallies through the neckline are always suspect. |

|
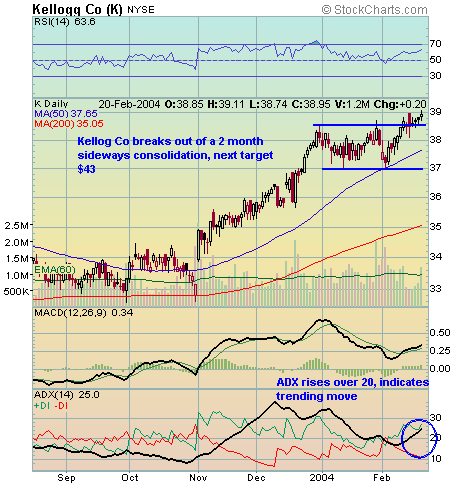
| Figure 1: Daily chart of Kellogg Co. |
| Graphic provided by: Stockchart.com. |
| |
| On the daily chart, Kellogg Co. has broken out of a two-month consolidation and is headed to the next target of $40 and eventually $43. A trending move has started, as shown by the rising ADX, now over 20. Note that Kellogg's stock has broken out of a consolidation just as the Dow has gone into a consolidation. Kellogg is outperforming the broader market and will move up even faster if the overall market starts moving up too. These are precisely the kind of stocks you want in bull markets. |
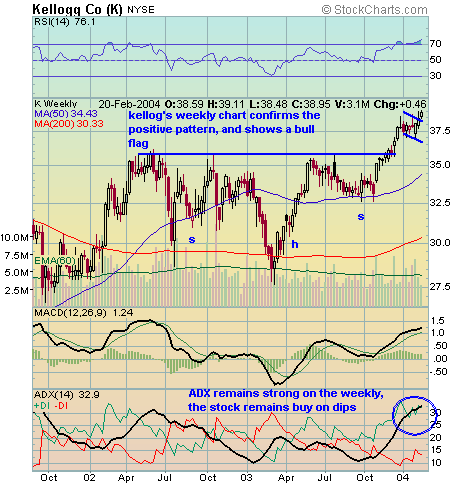
 Figure 2: Weekly chart of Kellogg Co. On the weekly chart Kellogg shows a breakout from a head and shoulders bottom, with an eventual target of $43.5. This is calculated by measuring the depth of the head from the neckline and adding that measurement on to the top of the neckline. The chart further shows a bull flag breakout which makes this one of the ideal times to go long on the stock. The weekly ADX is rising over 30 and shows an extremely strong medium-term trend. |
He is founder of AGIP Securities Pvt. Ltd. which offers money management services, live chat rooms (during market hours) and independent technical analysis consultancy. The company has a big media presence from the likes of CNBC, NDTV Profit, and ZEE Business.
| Title: | Chief mkt strategist |
| Company: | AGIP Securities |
| India | |
| Phone # for sales: | 9871066337 |
| Website: | www.ashwanigujral.com |
| E-mail address: | contact@ashwanigujral.com |
Traders' Resource Links | |
| AGIP Securities has not added any product or service information to TRADERS' RESOURCE. | |
Click here for more information about our publications!
Comments
Date: 02/29/04Rank: 5Comment:

Request Information From Our Sponsors
- StockCharts.com, Inc.
- Candle Patterns
- Candlestick Charting Explained
- Intermarket Technical Analysis
- John Murphy on Chart Analysis
- John Murphy's Chart Pattern Recognition
- John Murphy's Market Message
- MurphyExplainsMarketAnalysis-Intermarket Analysis
- MurphyExplainsMarketAnalysis-Visual Analysis
- StockCharts.com
- Technical Analysis of the Financial Markets
- The Visual Investor
- VectorVest, Inc.
- Executive Premier Workshop
- One-Day Options Course
- OptionsPro
- Retirement Income Workshop
- Sure-Fire Trading Systems (VectorVest, Inc.)
- Trading as a Business Workshop
- VectorVest 7 EOD
- VectorVest 7 RealTime/IntraDay
- VectorVest AutoTester
- VectorVest Educational Services
- VectorVest OnLine
- VectorVest Options Analyzer
- VectorVest ProGraphics v6.0
- VectorVest ProTrader 7
- VectorVest RealTime Derby Tool
- VectorVest Simulator
- VectorVest Variator
- VectorVest Watchdog
