HOT TOPICS LIST
- MACD
- Fibonacci
- RSI
- Gann
- ADXR
- Stochastics
- Volume
- Triangles
- Futures
- Cycles
- Volatility
- ZIGZAG
- MESA
- Retracement
- Aroon
INDICATORS LIST
LIST OF TOPICS
PRINT THIS ARTICLE
by Ashwani Gujral
The CAC (French index) broke out of the 3720 level to target the next level of 3840. Most European indexes entered a consolidation before the Dow and are breaking out before the Dow completes its consolidation. Looking for such intermarket relationships can help in analyzing the Dow.
Position: Buy
Ashwani Gujral
He is founder of AGIP Securities Pvt. Ltd. which offers money management services, live chat rooms (during market hours) and independent technical analysis consultancy. The company has a big media presence from the likes of CNBC, NDTV Profit, and ZEE Business.
PRINT THIS ARTICLE
FLAGS AND PENNANTS
The CAC Breaks Out Of A Consolidation
02/23/04 12:57:03 PMby Ashwani Gujral
The CAC (French index) broke out of the 3720 level to target the next level of 3840. Most European indexes entered a consolidation before the Dow and are breaking out before the Dow completes its consolidation. Looking for such intermarket relationships can help in analyzing the Dow.
Position: Buy
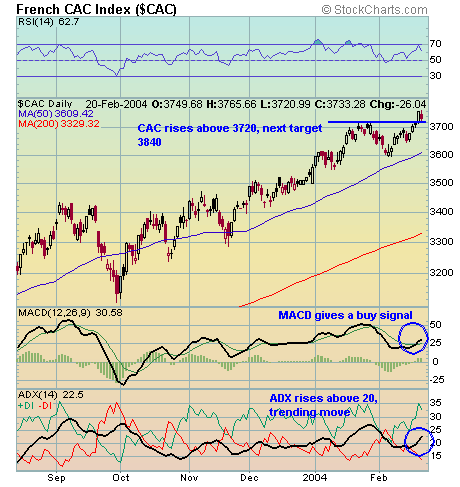
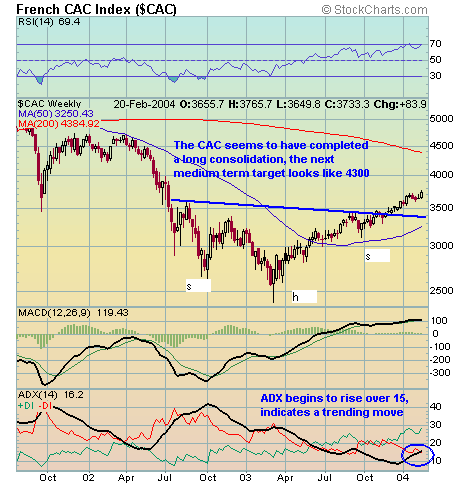
| Consolidation patterns offer low risk entry points into existing trends. A consolidation occurs during a trend, as market momentum falls only to build up again and continue in its original direction. In CAC's case, the daily chart is showing a consolidation pattern in an upward trend. The weekly chart shows a bull flag formation, which again supports the possibility of an upward breakout. This bull flag has also broken out to the upside. Flags and pennants are often small pauses where, after a rally or decline, the market catches its breath for a few days on lower volume, only to again continue in the direction of the original move. |

|
| Figure 1: Daily chart of the CAC. |
| Graphic provided by: Stockcharts.com. |
| |
| Looking at the CAC breaks out of a consolidation pattern on the daily chart at 3720 and heads towards the next target of 3840. The MACD gives a buy signal and the ADX signals a trending move by moving over 20. |
 Figure 2: Weekly chart of the CAC. On the weekly chart, the CAC has just completed a head and shoulders pattern. After the breakout the market moved higher, took a pause as a flag formed, and then broke out on the upside again. Flags generally occur in the middle of up or down moves and are among the surest and the easiest patterns to trade on all time frames. CAC's flag breakout on the weekly chart signals a move to 4300, which is also the target of the weekly head and shoulders pattern. |
He is founder of AGIP Securities Pvt. Ltd. which offers money management services, live chat rooms (during market hours) and independent technical analysis consultancy. The company has a big media presence from the likes of CNBC, NDTV Profit, and ZEE Business.
| Title: | Chief mkt strategist |
| Company: | AGIP Securities |
| India | |
| Phone # for sales: | 9871066337 |
| Website: | www.ashwanigujral.com |
| E-mail address: | contact@ashwanigujral.com |
Traders' Resource Links | |
| AGIP Securities has not added any product or service information to TRADERS' RESOURCE. | |
Click here for more information about our publications!
Comments
Date: 02/25/04Rank: 5Comment:

|

Request Information From Our Sponsors
- StockCharts.com, Inc.
- Candle Patterns
- Candlestick Charting Explained
- Intermarket Technical Analysis
- John Murphy on Chart Analysis
- John Murphy's Chart Pattern Recognition
- John Murphy's Market Message
- MurphyExplainsMarketAnalysis-Intermarket Analysis
- MurphyExplainsMarketAnalysis-Visual Analysis
- StockCharts.com
- Technical Analysis of the Financial Markets
- The Visual Investor
- VectorVest, Inc.
- Executive Premier Workshop
- One-Day Options Course
- OptionsPro
- Retirement Income Workshop
- Sure-Fire Trading Systems (VectorVest, Inc.)
- Trading as a Business Workshop
- VectorVest 7 EOD
- VectorVest 7 RealTime/IntraDay
- VectorVest AutoTester
- VectorVest Educational Services
- VectorVest OnLine
- VectorVest Options Analyzer
- VectorVest ProGraphics v6.0
- VectorVest ProTrader 7
- VectorVest RealTime Derby Tool
- VectorVest Simulator
- VectorVest Variator
- VectorVest Watchdog
