HOT TOPICS LIST
- MACD
- Fibonacci
- RSI
- Gann
- ADXR
- Stochastics
- Volume
- Triangles
- Futures
- Cycles
- Volatility
- ZIGZAG
- MESA
- Retracement
- Aroon
INDICATORS LIST
LIST OF TOPICS
PRINT THIS ARTICLE
by Ashwani Gujral
The FTSE is consolidating between 4360 and 4520. A breakout above 4520 could lead to 5000 for the FTSE in the medium-term. Indications are this could happen soon.
Position: Buy
Ashwani Gujral
He is founder of AGIP Securities Pvt. Ltd. which offers money management services, live chat rooms (during market hours) and independent technical analysis consultancy. The company has a big media presence from the likes of CNBC, NDTV Profit, and ZEE Business.
PRINT THIS ARTICLE
CONSOLID FORMATION
The FTSE Bottoms Out On The Weekly Chart
02/23/04 10:57:47 AMby Ashwani Gujral
The FTSE is consolidating between 4360 and 4520. A breakout above 4520 could lead to 5000 for the FTSE in the medium-term. Indications are this could happen soon.
Position: Buy
| Stocks and market indexes often go into sideways consolidations after an extended rally or decline. This gives the market an opportunity to digest the gains of the previous rally as old buyers take profits and new traders buy in. Thus for a period of time, equilibrium exists between the buyers and sellers. Eventually this equilibrium is broken either in favor of the bulls or bears. |
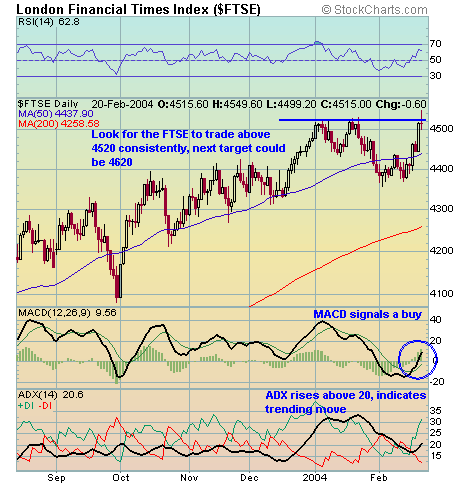
| The daily chart of the FTSE shows a failed breakout occurred during the last trading session (2/20/04). Now the key is to wait for the actual breakout rather than preempting it. |

|
| Figure 1: Daily chart of FTSE. |
| Graphic provided by: Stockcharts.com. |
| |
| Traders should always wait for a high volume breakout and for the market to stay above the breakout for a couple of trading sessions before taking positions. In the meantime, various indicators support my optimism for the FTSE. The MACD has signaled a buy and the ADX has risen over 20, signaling a trending move. But I would wait for the actual breakout to take positions. Once this occurs, the first target would be the distance equivalent to the width of the breakout pattern. Here I should mention that traders can get trapped in a false breakout. To avoid this, check the volume and be extremely skeptical of low volume breakouts. |
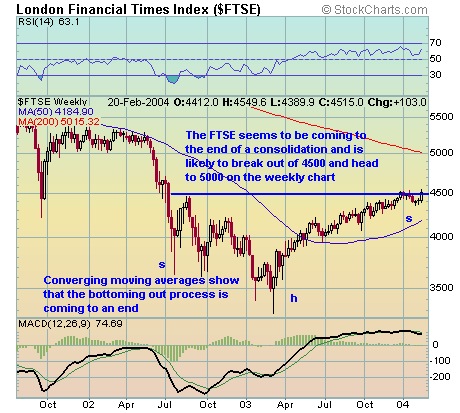
 Figure 2: Weekly chart of FTSE. On the weekly chart the FTSE is coming to the end of a 2-year consolidation, and a breakout over the 4500 level would have the FTSE targeting the 5000 level. After that it could possibly reach 5500, the target of the weekly head and shoulders pattern. The turning of the 50-week MA towards the 200-week MA also suggests the FTSE has bottomed out in the medium-term. The weekly indicators are likely to take a couple of weeks to reflect the daily bullishness on the charts. |
He is founder of AGIP Securities Pvt. Ltd. which offers money management services, live chat rooms (during market hours) and independent technical analysis consultancy. The company has a big media presence from the likes of CNBC, NDTV Profit, and ZEE Business.
| Title: | Chief mkt strategist |
| Company: | AGIP Securities |
| India | |
| Phone # for sales: | 9871066337 |
| Website: | www.ashwanigujral.com |
| E-mail address: | contact@ashwanigujral.com |
Traders' Resource Links | |
| AGIP Securities has not added any product or service information to TRADERS' RESOURCE. | |
Click here for more information about our publications!
Comments
Date: 02/23/04Rank: 5Comment:
Date: 02/25/04Rank: 4Comment:

Request Information From Our Sponsors
- StockCharts.com, Inc.
- Candle Patterns
- Candlestick Charting Explained
- Intermarket Technical Analysis
- John Murphy on Chart Analysis
- John Murphy's Chart Pattern Recognition
- John Murphy's Market Message
- MurphyExplainsMarketAnalysis-Intermarket Analysis
- MurphyExplainsMarketAnalysis-Visual Analysis
- StockCharts.com
- Technical Analysis of the Financial Markets
- The Visual Investor
- VectorVest, Inc.
- Executive Premier Workshop
- One-Day Options Course
- OptionsPro
- Retirement Income Workshop
- Sure-Fire Trading Systems (VectorVest, Inc.)
- Trading as a Business Workshop
- VectorVest 7 EOD
- VectorVest 7 RealTime/IntraDay
- VectorVest AutoTester
- VectorVest Educational Services
- VectorVest OnLine
- VectorVest Options Analyzer
- VectorVest ProGraphics v6.0
- VectorVest ProTrader 7
- VectorVest RealTime Derby Tool
- VectorVest Simulator
- VectorVest Variator
- VectorVest Watchdog
