HOT TOPICS LIST
- MACD
- Fibonacci
- RSI
- Gann
- ADXR
- Stochastics
- Volume
- Triangles
- Futures
- Cycles
- Volatility
- ZIGZAG
- MESA
- Retracement
- Aroon
INDICATORS LIST
LIST OF TOPICS
PRINT THIS ARTICLE
by Matt Blackman
Insiders have sold a whopping 170 million shares in this company in the last three months and their chart is forming a complex head & shoulders top signal. Coincidence?
Position: N/A
Matt Blackman
Matt Blackman is a full-time technical and financial writer and trader. He produces corporate and financial newsletters, and assists clients in getting published in the mainstream media. He is the host of TradeSystemGuru.com. Matt has earned the Chartered Market Technician (CMT) designation. Find out what stocks and futures Matt is watching on Twitter at www.twitter.com/RatioTrade
PRINT THIS ARTICLE
HEAD & SHOULDERS
MEMC Electronics' Complex Head & Shoulders Top
02/23/04 01:12:33 PMby Matt Blackman
Insiders have sold a whopping 170 million shares in this company in the last three months and their chart is forming a complex head & shoulders top signal. Coincidence?
Position: N/A
| In a regular scan of Insider Spotlight in the Wall Street Journal, MEMC Electronics (WFR) was listed in first position for insider sales with two sales of 34 million shares each reported for the week ending February 13, 2004. This brings the total sold in the last three months to 170 million. Needless to say it raised my curiosity. |

|
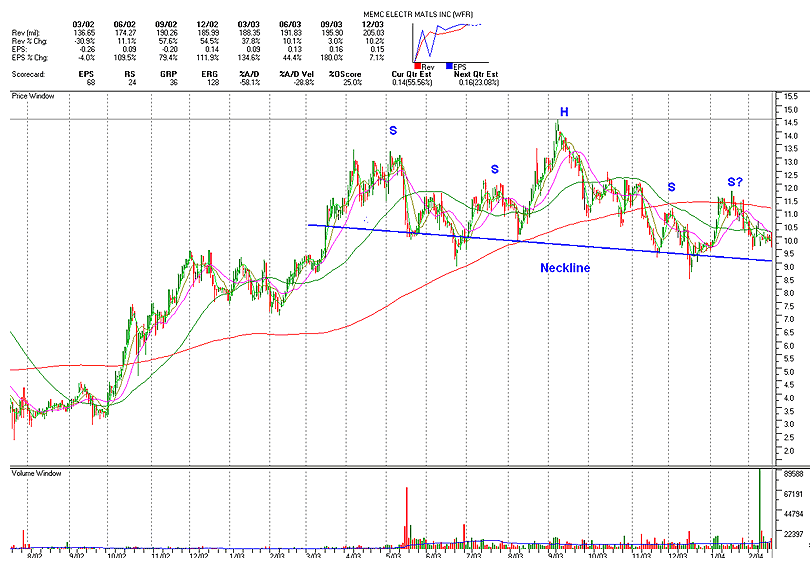
| Figure 1 – Daily chart of MEMC Electronic Materials Inc. (WFR) showing complex head & shoulders top pattern in the process of completion. Chart provided by highgrowthstock.com, Data by Quotes Plus. |
| |
| A look at the chart reveals what looks to be a trend reversal in the form of a classic complex head & shoulders top pattern. The pattern will be confirmed if price can break the neckline around the $9.00 range in the next two to three weeks. If that happens, the downside target, as measured from the neckline to head and subtracting it from the neckline at the break point, would take the stock into the mid $4.00 range. The stock has moved below its 50- and 200-day simple moving averages in the last 20 trading days, confirming the bearish trend. Also note the symmetrical triangle on the right side of the chart (not drawn). Assuming the neckline is broken by the new shoulder forming on the right side, the minimum downside target, calculated by measuring the distance from the head down to the neckline and subtracting it from the price break at the neckline on the far right, is in the $4.50 range. |
| The fundamental data at the top of the screen provides those traders who have an interest in fundamentals and use this program, a quick and easy way of searching for trading candidates by screening for both technical and fundamental events together. Speaking about fundamentals, they don't look all that bad for this company. It has a P/E ratio (trailing twelve months) of 18 and a forward P/E of 15 based on 2004 estimated earnings. On the negative side, short interest sits at 7.4% of float. Anything higher than 5% is a concern. The price/sales ratio is somewhat high at 2.5 and it has a book value of 1/10th the current stock price. The big question remains: why are insiders selling huge portions of their shares? It appears that insiders have sold major portions of their holdings in the last three months alone. This one bears watching, especially if the markets are in the process of a long awaited correction. |
| SUGGESTED READING: Wall Street Journal Insider Spotlight (Subscription to Wall Street Journal required). http://online.wsj.com/edition/resources/documents/mktindex.htm?insider1.htm&menu9.htm Explanation of High Growth Stocks Charting System http://www.highgrowthstock.com/Demos/default.htm Seyhun, Nejat H. [2000] "Investment Intelligence from Insider Trading," MIT Press |
Matt Blackman is a full-time technical and financial writer and trader. He produces corporate and financial newsletters, and assists clients in getting published in the mainstream media. He is the host of TradeSystemGuru.com. Matt has earned the Chartered Market Technician (CMT) designation. Find out what stocks and futures Matt is watching on Twitter at www.twitter.com/RatioTrade
| Company: | TradeSystemGuru.com |
| Address: | Box 2589 |
| Garibaldi Highlands, BC Canada | |
| Phone # for sales: | 604-898-9069 |
| Fax: | 604-898-9069 |
| Website: | www.tradesystemguru.com |
| E-mail address: | indextradermb@gmail.com |
Traders' Resource Links | |
| TradeSystemGuru.com has not added any product or service information to TRADERS' RESOURCE. | |
Click here for more information about our publications!
PRINT THIS ARTICLE

|

Request Information From Our Sponsors
- StockCharts.com, Inc.
- Candle Patterns
- Candlestick Charting Explained
- Intermarket Technical Analysis
- John Murphy on Chart Analysis
- John Murphy's Chart Pattern Recognition
- John Murphy's Market Message
- MurphyExplainsMarketAnalysis-Intermarket Analysis
- MurphyExplainsMarketAnalysis-Visual Analysis
- StockCharts.com
- Technical Analysis of the Financial Markets
- The Visual Investor
- VectorVest, Inc.
- Executive Premier Workshop
- One-Day Options Course
- OptionsPro
- Retirement Income Workshop
- Sure-Fire Trading Systems (VectorVest, Inc.)
- Trading as a Business Workshop
- VectorVest 7 EOD
- VectorVest 7 RealTime/IntraDay
- VectorVest AutoTester
- VectorVest Educational Services
- VectorVest OnLine
- VectorVest Options Analyzer
- VectorVest ProGraphics v6.0
- VectorVest ProTrader 7
- VectorVest RealTime Derby Tool
- VectorVest Simulator
- VectorVest Variator
- VectorVest Watchdog
