HOT TOPICS LIST
- MACD
- Fibonacci
- RSI
- Gann
- ADXR
- Stochastics
- Volume
- Triangles
- Futures
- Cycles
- Volatility
- ZIGZAG
- MESA
- Retracement
- Aroon
INDICATORS LIST
LIST OF TOPICS
PRINT THIS ARTICLE
by Koos van der Merwe
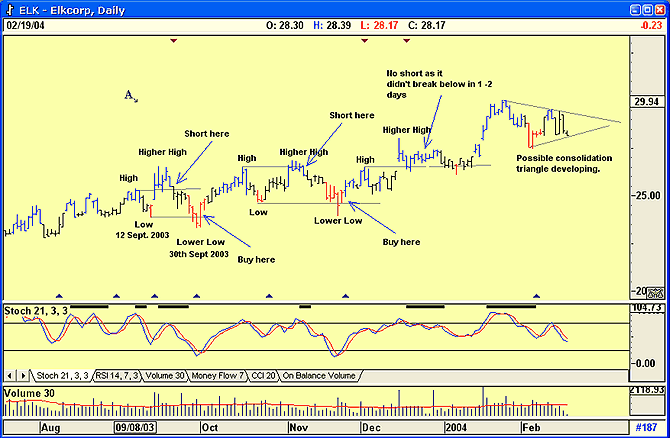
On February 19, Traders.com published my article on the trading strategy "Buying At The Bottom." Below is a chart showing how to trade both long and short using this strategy.
Position: N/A
Koos van der Merwe
Has been a technical analyst since 1969, and has worked as a futures and options trader with First Financial Futures in Johannesburg, South Africa.
PRINT THIS ARTICLE
BREAKOUTS
End Of Day Trading With Double Bottoms
02/23/04 09:59:15 AMby Koos van der Merwe
On February 19, Traders.com published my article on the trading strategy "Buying At The Bottom." Below is a chart showing how to trade both long and short using this strategy.
Position: N/A
| The strategy looks at the formation of a bottom, followed by a lower bottom. This pattern identifies a "watch me" stock. When the price rises above the lower bottom, then look at the open of the next day and add half of the trading range to that open. If the price, intraday, rises above the result of the calculation, you would buy the stock. |
| I have detailed the strategy below using Elkcorp (ELK) as an example. Calculate the trading range of the previous day (the difference between the high and the low). This figure would be halved and added to the opening price of that day. This is the "buy target." When the price moves above the buy target, buy. Buy target = Today's open + (high of previous day - low of previous day)/2. This buy target is conservative as it looks for upward momentum before buying the stock. Therefore, purchase the stock if the close should move higher than the previous day's high. However, the open for the day should be below the previous day's high, otherwise the stock would open with a gap, and we all know that prices usually fall to fill a gap. |

|
| The long and the short of it. |
| Graphic provided by: AdvancedGET. |
| |
| Buy target 2 = Close > yesterday's high and open < yesterday's high. You can also short a stock. Here you would look for a high, a retracement, and then a higher high. Should the stock then fall below the first high, short on one of either sell targets below, depending on your risk profile. |
| Sell target = Today's open - (high of previous day - low of previous day)/2 Sell target 2 = Today's close < yesterdays low. Of course, in all cases make sure that you are not trading against the trend or the indicator of your choice. |
| Finally, never ignore other patterns that develop. In the chart above, a consolidation pattern is developing. Don't ignore the pattern. The downward moving stochastic suggests that it could change into a pennant. |
Has been a technical analyst since 1969, and has worked as a futures and options trader with First Financial Futures in Johannesburg, South Africa.
| Address: | 3256 West 24th Ave |
| Vancouver, BC | |
| Phone # for sales: | 6042634214 |
| E-mail address: | petroosp@gmail.com |
Click here for more information about our publications!
PRINT THIS ARTICLE

Request Information From Our Sponsors
- StockCharts.com, Inc.
- Candle Patterns
- Candlestick Charting Explained
- Intermarket Technical Analysis
- John Murphy on Chart Analysis
- John Murphy's Chart Pattern Recognition
- John Murphy's Market Message
- MurphyExplainsMarketAnalysis-Intermarket Analysis
- MurphyExplainsMarketAnalysis-Visual Analysis
- StockCharts.com
- Technical Analysis of the Financial Markets
- The Visual Investor
- VectorVest, Inc.
- Executive Premier Workshop
- One-Day Options Course
- OptionsPro
- Retirement Income Workshop
- Sure-Fire Trading Systems (VectorVest, Inc.)
- Trading as a Business Workshop
- VectorVest 7 EOD
- VectorVest 7 RealTime/IntraDay
- VectorVest AutoTester
- VectorVest Educational Services
- VectorVest OnLine
- VectorVest Options Analyzer
- VectorVest ProGraphics v6.0
- VectorVest ProTrader 7
- VectorVest RealTime Derby Tool
- VectorVest Simulator
- VectorVest Variator
- VectorVest Watchdog
