HOT TOPICS LIST
- MACD
- Fibonacci
- RSI
- Gann
- ADXR
- Stochastics
- Volume
- Triangles
- Futures
- Cycles
- Volatility
- ZIGZAG
- MESA
- Retracement
- Aroon
INDICATORS LIST
LIST OF TOPICS
PRINT THIS ARTICLE
by Gary Grosschadl
Ebay, Inc. (EBAY) has had an admirable rise in the last three months along with the overall indexes. Now however it is looking like it could be topping out with a classic double top pattern.
Position: Sell
Gary Grosschadl
Independent Canadian equities trader and technical analyst based in Peterborough
Ontario, Canada.
PRINT THIS ARTICLE
DOUBLE TOPS
Don't Overpay For Ebay
02/20/04 10:25:08 AMby Gary Grosschadl
Ebay, Inc. (EBAY) has had an admirable rise in the last three months along with the overall indexes. Now however it is looking like it could be topping out with a classic double top pattern.
Position: Sell
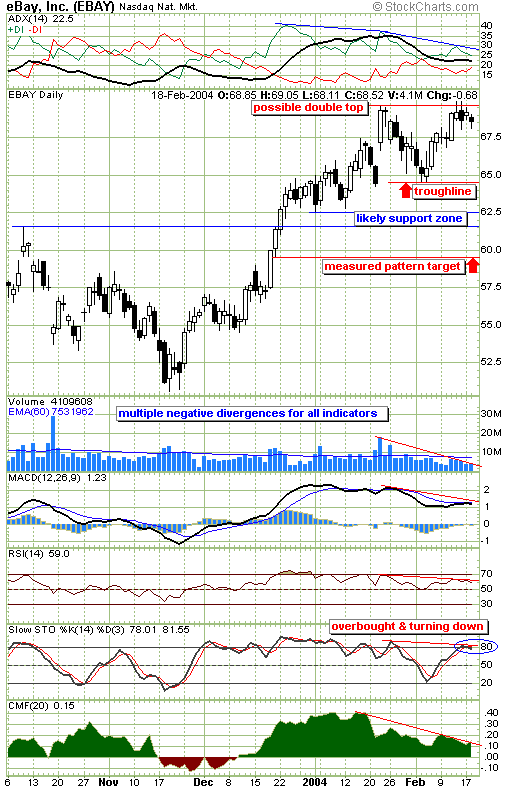
| At this point it can only be considered a double top threat as the actual double top would be confirmed with a break below its troughline. I am suggesting a possible double top because of the many negative divergences seen on this daily chart. |
| Earlier in the week there were two candlestick hints at a possible topping phase. The first was a shooting star candlestick with its characteristic long upper shadow and small candle body, followed by a couple of spinning top candlesticks with, again, small candle bodies and shadows on both ends. Both these formations suggest a hesitation or loss of upside bullish momentum. These top warnings have yet to confirm by breaking below $67.50 (bottom of previous large bullish candlestick), or to negate the candle warnings with a move to a new high. |

|
| EBAY in danger of topping out on this daily chart. |
| Graphic provided by: Stockcharts.com. |
| |
| The many negative divergences are noteworthy and lead me to believe the downside probability is greater than any upside. At the top of the chart, notice the peaks on the +DI (bullish movement component of the DMI or directional movement indicator). The first two +DI peaks showed negative divergence to price action, followed by a downleg, establishing the troughline. Now in a similar fashion there is a negative divergence hinting at a downleg. Next is a negative divergence between price action and volume, showing much less conviction by the bulls that this recent high is sustainable. All the lower indicators are also displaying negative divergences. The stochastics indicator shows an overbought situation with a downturn beginning from the 80 level. The CMF or Chaiken money flow indicator also shows a distinct divergence to price action, this being noteworthy because it reflects a supply and demand relationship versus the standard trend and momentum indicators. |
| If the overall markets surge higher this stock can follow in sympathy but upside seems limited with so many negative divergences. A move below $67.50 may be an indication a double top failure. If so, then two downside targets are shown. The first is the zone between $61.50 and 62.50 marked by a previous shooting star at the extreme left of the chart. The lower target would be $59.50. This is the measured completion target from the top to the troughline applied to a downside move below the troughline. This of course doesn't mean it will go down that far, only that it can, should a sufficiently bearish situation arise. |
Independent Canadian equities trader and technical analyst based in Peterborough
Ontario, Canada.
| Website: | www.whatsonsale.ca/financial.html |
| E-mail address: | gwg7@sympatico.ca |
Click here for more information about our publications!
Comments
Date: 02/22/04Rank: 5Comment: To Mr. Grosschadl
Could there also be a bearish wedge forming up near the current price ?
Thanks, Earl

Request Information From Our Sponsors
- StockCharts.com, Inc.
- Candle Patterns
- Candlestick Charting Explained
- Intermarket Technical Analysis
- John Murphy on Chart Analysis
- John Murphy's Chart Pattern Recognition
- John Murphy's Market Message
- MurphyExplainsMarketAnalysis-Intermarket Analysis
- MurphyExplainsMarketAnalysis-Visual Analysis
- StockCharts.com
- Technical Analysis of the Financial Markets
- The Visual Investor
- VectorVest, Inc.
- Executive Premier Workshop
- One-Day Options Course
- OptionsPro
- Retirement Income Workshop
- Sure-Fire Trading Systems (VectorVest, Inc.)
- Trading as a Business Workshop
- VectorVest 7 EOD
- VectorVest 7 RealTime/IntraDay
- VectorVest AutoTester
- VectorVest Educational Services
- VectorVest OnLine
- VectorVest Options Analyzer
- VectorVest ProGraphics v6.0
- VectorVest ProTrader 7
- VectorVest RealTime Derby Tool
- VectorVest Simulator
- VectorVest Variator
- VectorVest Watchdog
