HOT TOPICS LIST
- MACD
- Fibonacci
- RSI
- Gann
- ADXR
- Stochastics
- Volume
- Triangles
- Futures
- Cycles
- Volatility
- ZIGZAG
- MESA
- Retracement
- Aroon
INDICATORS LIST
LIST OF TOPICS
PRINT THIS ARTICLE
by Matt Blackman
The stock took a dive around Halloween but it appears that investors may have overreacted to a make-believe ghost. Those with stronger nerve have been slowly but surely picking this one up and now the word's getting out.
Position: N/A
Matt Blackman
Matt Blackman is a full-time technical and financial writer and trader. He produces corporate and financial newsletters, and assists clients in getting published in the mainstream media. He is the host of TradeSystemGuru.com. Matt has earned the Chartered Market Technician (CMT) designation. Find out what stocks and futures Matt is watching on Twitter at www.twitter.com/RatioTrade
PRINT THIS ARTICLE
ISLAND REVERSAL
First Health Back In The Pink?
02/19/04 11:34:59 AMby Matt Blackman
The stock took a dive around Halloween but it appears that investors may have overreacted to a make-believe ghost. Those with stronger nerve have been slowly but surely picking this one up and now the word's getting out.
Position: N/A
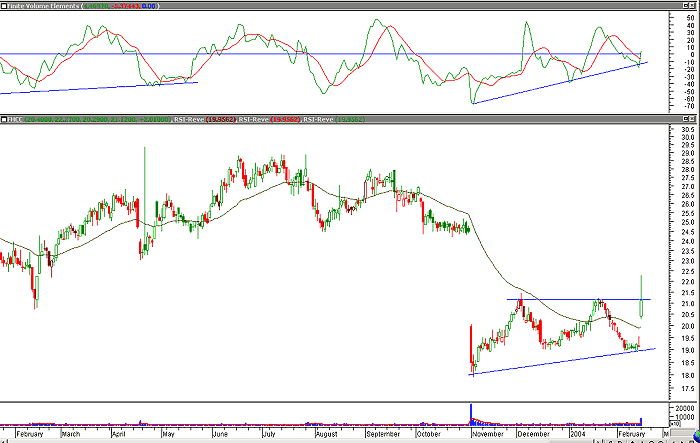
| In trying to lessen investor expectations, First Health CEO announced that the company's earnings would be flat in 2004 at approximately $1.55 per share in early November. But it may have been his use of the phrase "a perfect storm" in the health care business that did it: following his candor, investors ran for the hills like they'd seen, well, a ghost. The stock plunged 25% overnight, dropping from $25 to $18.45. But since then, it appears that cooler, more logical minds have prevailed and have been picking up shares that were dumped in haste, like bigger kids taking candy dropped by frightened toddlers. |

|
| Figure 1 – Daily chart of FHCC showing a panic gap on November 3 and building ascending triangle and potential island reversal. The top window shows positive divergence between the finite volume element indicator and price. |
| Graphic provided by: MetaStock. |
| |
| The chart pattern shows it all. After forming a cavernous gap down on November 3, the stock began runing back up again and partially filled the hole until it hit $21.15. It dropped down again on some expected profit taking twice but then on February 17, gapped up to the resistance level again forming a nascent ascending triangle supported by a re-engineered RSI (Figure 1). Positive divergence was also evident between the finite volume element indicator and price. To make it all the more attractive from a technical standpoint, the pattern also looks to be a potential island reversal with a gap desperately begging to be filled. |
| Fundamentals look quite healthy indeed, with a modest price-to-earnings ratio of 12.6, which is downright cheap when you consider that S&P 500 trailing-twelve-month (TTM) earnings are touching the ceiling near 40. (They were around 30 before the bear began in earnest in late 2000.) Both the quarterly revenue and income graphs show a steady growth which has got to warm the cockles of any investor's heart. But talking about high valuations brings up another point. This stock is an interesting play if the market continues to move higher but no one really knows how high it can go before the much awaited correction comes. Even if the market begins a slow roll over, this stock could be a good defensive play longer-term. I would like to see some slow and steady volume growth on upside price movement to show that there is continued commitment to buy this stock and a break within the next 30-40 days of the resistance at $21.15. But after that, it could be clear sailing back into the mid- to high twenties, or at least until the next big scare comes along. |
Matt Blackman is a full-time technical and financial writer and trader. He produces corporate and financial newsletters, and assists clients in getting published in the mainstream media. He is the host of TradeSystemGuru.com. Matt has earned the Chartered Market Technician (CMT) designation. Find out what stocks and futures Matt is watching on Twitter at www.twitter.com/RatioTrade
| Company: | TradeSystemGuru.com |
| Address: | Box 2589 |
| Garibaldi Highlands, BC Canada | |
| Phone # for sales: | 604-898-9069 |
| Fax: | 604-898-9069 |
| Website: | www.tradesystemguru.com |
| E-mail address: | indextradermb@gmail.com |
Traders' Resource Links | |
| TradeSystemGuru.com has not added any product or service information to TRADERS' RESOURCE. | |
Click here for more information about our publications!
PRINT THIS ARTICLE

Request Information From Our Sponsors
- StockCharts.com, Inc.
- Candle Patterns
- Candlestick Charting Explained
- Intermarket Technical Analysis
- John Murphy on Chart Analysis
- John Murphy's Chart Pattern Recognition
- John Murphy's Market Message
- MurphyExplainsMarketAnalysis-Intermarket Analysis
- MurphyExplainsMarketAnalysis-Visual Analysis
- StockCharts.com
- Technical Analysis of the Financial Markets
- The Visual Investor
- VectorVest, Inc.
- Executive Premier Workshop
- One-Day Options Course
- OptionsPro
- Retirement Income Workshop
- Sure-Fire Trading Systems (VectorVest, Inc.)
- Trading as a Business Workshop
- VectorVest 7 EOD
- VectorVest 7 RealTime/IntraDay
- VectorVest AutoTester
- VectorVest Educational Services
- VectorVest OnLine
- VectorVest Options Analyzer
- VectorVest ProGraphics v6.0
- VectorVest ProTrader 7
- VectorVest RealTime Derby Tool
- VectorVest Simulator
- VectorVest Variator
- VectorVest Watchdog
