HOT TOPICS LIST
- MACD
- Fibonacci
- RSI
- Gann
- ADXR
- Stochastics
- Volume
- Triangles
- Futures
- Cycles
- Volatility
- ZIGZAG
- MESA
- Retracement
- Aroon
INDICATORS LIST
LIST OF TOPICS
PRINT THIS ARTICLE
by Kevin Hopson
Though the AMEX Oil Index has appreciated roughly 45 percent over the past year, there are still signs of higher prices ahead.
Position: Accumulate
Kevin Hopson
Kevin has been a technical analyst for roughly 10 years now. Previously, Kevin owned his own business and acted as a registered investment advisor, specializing in energy. He was also a freelance oil analyst for Orient Trading Co., a commodity futures trading firm in Japan. Kevin is currently a freelance writer.
PRINT THIS ARTICLE
TECHNICAL ANALYSIS
Pessimism Grows Towards Integrated Oil Stocks
02/17/04 10:04:01 AMby Kevin Hopson
Though the AMEX Oil Index has appreciated roughly 45 percent over the past year, there are still signs of higher prices ahead.
Position: Accumulate
| The AMEX Oil Index (XOI), a price-weighted index of integrated oil companies, has been in a strong uptrend since bottoming out last March. If you remember back, I said that last March's low likely indicated a significant bottom for the index - or the end of the group's long-term downtrend. As a result, I recommended accumulating shares of integrated oil stocks in anticipation of a new long-term uptrend developing. Since then, the index has appreciated roughly 45 percent, more than confirming my bullish outlook. |
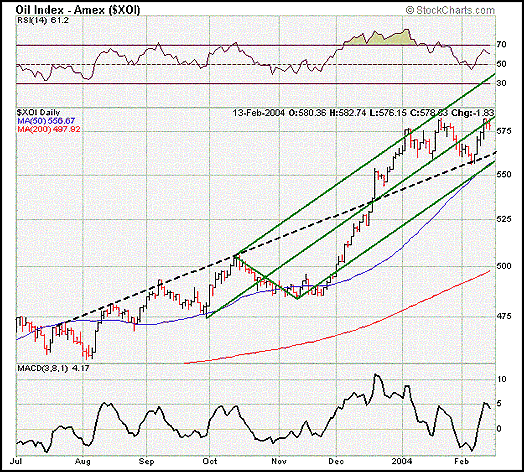
| The index has showed no signs of letting up. Looking at the eight-month chart, you will notice that during the recent uptrend the XOI has continued to find support along its rising 50-day moving average. Additionally, the prior uptrend line (dotted black line) - which had acted as resistance up until the middle of December - recently turned into support. Though the index is currently finding resistance along the green median line, this should only act as a temporary barrier before moving higher. |

|
| Graphic provided by: Stockcharts.com. |
| |
| Looking at market sentiment towards the group, there are no signs of a significant top developing. Short interest for the index has grown from roughly 66.6M shares in November to 96.4M shares in January, an increase of nearly 45 percent. Additionally, the number of analysts with buy ratings on these stocks has fallen from roughly 45 percent to just under 40 percent during this time period. This increase in pessimism has occurred even though the index has been moving higher, normally a sign that prices have further upside potential. As a result, I would continue to accumulate shares of integrated oil stocks in the near-term. Look for support in the 555 to 565 range, the site of the index's 50-day moving average, the bottom green parallel line and the black uptrend line. |
Kevin has been a technical analyst for roughly 10 years now. Previously, Kevin owned his own business and acted as a registered investment advisor, specializing in energy. He was also a freelance oil analyst for Orient Trading Co., a commodity futures trading firm in Japan. Kevin is currently a freelance writer.
| Glen Allen, VA | |
| E-mail address: | hopson_1@yahoo.com |
Click here for more information about our publications!
Comments
Date: 02/18/04Rank: 4Comment:
Date: 02/24/04Rank: 5Comment:
Date: 02/25/04Rank: 3Comment: but what are integrated oil stocks?

Request Information From Our Sponsors
- StockCharts.com, Inc.
- Candle Patterns
- Candlestick Charting Explained
- Intermarket Technical Analysis
- John Murphy on Chart Analysis
- John Murphy's Chart Pattern Recognition
- John Murphy's Market Message
- MurphyExplainsMarketAnalysis-Intermarket Analysis
- MurphyExplainsMarketAnalysis-Visual Analysis
- StockCharts.com
- Technical Analysis of the Financial Markets
- The Visual Investor
- VectorVest, Inc.
- Executive Premier Workshop
- One-Day Options Course
- OptionsPro
- Retirement Income Workshop
- Sure-Fire Trading Systems (VectorVest, Inc.)
- Trading as a Business Workshop
- VectorVest 7 EOD
- VectorVest 7 RealTime/IntraDay
- VectorVest AutoTester
- VectorVest Educational Services
- VectorVest OnLine
- VectorVest Options Analyzer
- VectorVest ProGraphics v6.0
- VectorVest ProTrader 7
- VectorVest RealTime Derby Tool
- VectorVest Simulator
- VectorVest Variator
- VectorVest Watchdog
