HOT TOPICS LIST
- MACD
- Fibonacci
- RSI
- Gann
- ADXR
- Stochastics
- Volume
- Triangles
- Futures
- Cycles
- Volatility
- ZIGZAG
- MESA
- Retracement
- Aroon
INDICATORS LIST
LIST OF TOPICS
PRINT THIS ARTICLE
by Koos van der Merwe
Over the years, I have learned that the simplest strategies always give the best results. Here is a strategy that I read about recently that was so underemphasized, it almost slipped by me unnoticed. I have tested it, improved on it, and I must say, it looks pretty good.
Position: N/A
Koos van der Merwe
Has been a technical analyst since 1969, and has worked as a futures and options trader with First Financial Futures in Johannesburg, South Africa.
PRINT THIS ARTICLE
TRADING SYSTEMS
Buying At The Bottom
02/19/04 09:46:31 AMby Koos van der Merwe
Over the years, I have learned that the simplest strategies always give the best results. Here is a strategy that I read about recently that was so underemphasized, it almost slipped by me unnoticed. I have tested it, improved on it, and I must say, it looks pretty good.
Position: N/A
| The technique is the Double Bottom strategy. It defines a double bottom as a bottom, followed by a retracement, and another, lower bottom. You buy when the price rises above the low of the first bottom. |
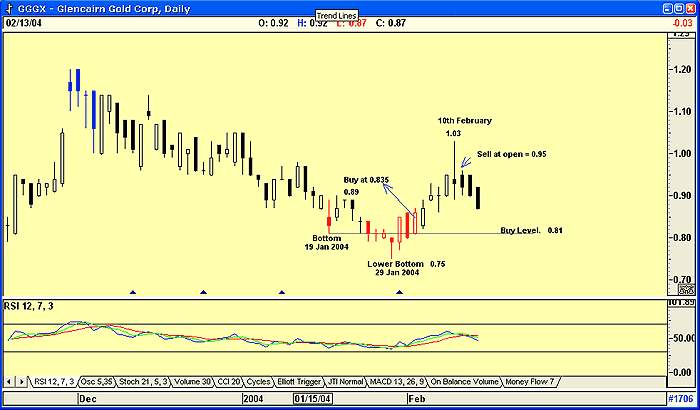
| I have written an exploration program to analyze the market and identify this type of double bottom. It gives a signal after the double bottom has formed and the price has risen above the low of the first bottom. It usually picks out three or four stocks per day. These are easy to chart and a quick look at an RSI indicator will finalize my decision to pursue the stock or not. Figure 1 gives an example using Glencairn Gold Corp. (GGGX). |

|
| Figure 1: The Double Bottom strategy. |
| Graphic provided by: AdvancedGET. |
| |
| The first bottom occured on January 19, at $0.81. The price then rose to $0.89 before falling back to a lower bottom of $0.75 on January 29. I then waited for the price to rise to $0.81, triggering the strategy, which it did the very next day, January 30th. I amended the strategy by making sure I bought into the stock in the direction of the trend. I found that, although a stock may break above the low of the first bottom as it strengthened, the trend was not always up and a buy signal could have been incorrectly triggered. The move up could simply have been a dead cat bounce. |
| Once I picked out a stock, I then determined a true entry level by calculating the previous day's trading range -- the difference between the high and the low -- dividing this figure by two, and adding the result to the next day's open. This gives me an entry target that the price must exceed before I will institute a buy. For example, in GGGX's chart, the high on January 29 was $0.80 and the low was $0.75, giving me a trading range of $0.05. I then took half this range, $0.25, and added it to the open of the next day, January 30. If the price then broke above this level, I would buy. There are also certain rules that I follow. 1. I never trade in the first half hour of trading unless I am closing a previous day's trade because of market momentum. I believe that the first half hour reflects too much of the previous day's decision making and this can only be beneficial if the last half hour's trading of the previous day had strong momentum. 2. I never take a position against the RSI/stochastic or any other favored indicator that gives market direction. In other words, I will never trade against the trend. 3. I always use a stop-loss. The stop-loss I prefer using is either the previous day's trading range deducted from the highest high, or 5% of the highest high depending on whether I am trading intraday or daily. 4. Because I am trading with small movements in the share price, I always make sure that I purchase a sufficient quantity of shares to give me no less than a $200 profit. Not that I will always achieve this figure, but it is a guide. 5. Finally, I always work on a 2.5:1 risk reward ratio, which means that for a target profit of $200, the amount I am prepared to lose is $80. |
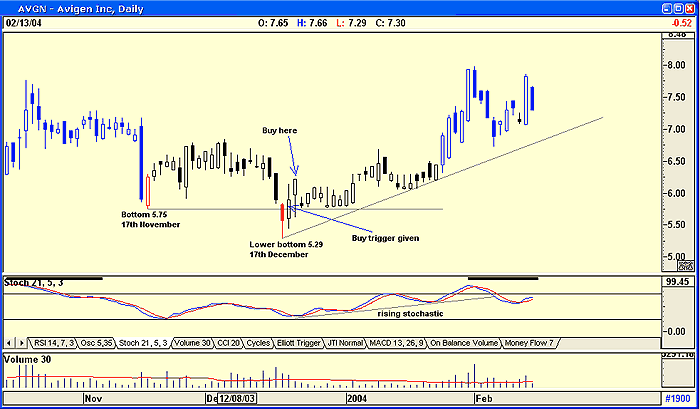
| Trading the chart above, I would have received a "watch me" warning on January 30th. I would therefore have waited until the next trading day, February 2nd, to place an order. The open for this day was $0.86 and adding $0.04 (High - low of January 30th = 0.85 - 0.77 = 0.08 / 2 = 0.04) gives me a buy level of 0.90. The highest the price reached on February 2nd was $0.86, so I would not have bought. The trading range for February 2nd was $0.86 for the high, and $0.80 for the low, giving me a figure of $0.06. Half of this range is $0.03. My buy level therefore for February 3rd was the opening price of the 3rd, which was $0.81 plus $0.03 = $0.84. The high for the day was $0.87, so my purchase order would have been filled at $0.84. The price rose to $1.03 by February 10th. My exit strategy would have been the highest high less 5%. So, should the price fall below 0.98, I would sell. The price closed at $0.93, triggering a stop-loss sell signal. On February 11th I would have put in a sell order at the open, and would probably have been filled at $0.95. This would have given me a profit of $0.11 per share. ($0.95 - $0.84 = $0.11) It doesn't sound like much, but at least it was a profit. I could have calculated a profit target, let's say of $200. For example, had I purchased 5,000 shares, at 0.84, my outlay would have been $4,200 before commissions. Add $200 to this gives me $4,400. Divided by 5,000 = $0.88. In fact, I exited at $0.95 with a profit of $550 (5,000 x 0.11 = $550), a 13% return for a seven day outlay.  Figure 2: Avigen (AVGN) buy signals. Finally, you may find that often you have to wait a few days before entering, as show in Figure 2. The buy signal was only given on January 5th, but the result of the trade was worth the monitoring. |
Has been a technical analyst since 1969, and has worked as a futures and options trader with First Financial Futures in Johannesburg, South Africa.
| Address: | 3256 West 24th Ave |
| Vancouver, BC | |
| Phone # for sales: | 6042634214 |
| E-mail address: | petroosp@gmail.com |
Click here for more information about our publications!
Comments
Date: 02/21/04Rank: 5Comment: THANKS, Earl
Date: 02/22/04Rank: 4Comment:
Date: 02/24/04Rank: 4Comment:
Date: 02/24/04Rank: 4Comment:
Date: 03/28/04Rank: 5Comment: To Jacob Singer
In your article Buying At The Bottom ,you mentioned an exploration you had discovered to search for such canidates of stocks that may fit this trading strategy. The article was good and the method looks profitable, but you didn t reveal the language for the strategy. I use Metastock and would be interested in your exploration if you want to reveal it? THANKS, Earl
E-mail; RPA6843332@aol.com
Date: 06/20/04Rank: 2Comment:

Request Information From Our Sponsors
- StockCharts.com, Inc.
- Candle Patterns
- Candlestick Charting Explained
- Intermarket Technical Analysis
- John Murphy on Chart Analysis
- John Murphy's Chart Pattern Recognition
- John Murphy's Market Message
- MurphyExplainsMarketAnalysis-Intermarket Analysis
- MurphyExplainsMarketAnalysis-Visual Analysis
- StockCharts.com
- Technical Analysis of the Financial Markets
- The Visual Investor
- VectorVest, Inc.
- Executive Premier Workshop
- One-Day Options Course
- OptionsPro
- Retirement Income Workshop
- Sure-Fire Trading Systems (VectorVest, Inc.)
- Trading as a Business Workshop
- VectorVest 7 EOD
- VectorVest 7 RealTime/IntraDay
- VectorVest AutoTester
- VectorVest Educational Services
- VectorVest OnLine
- VectorVest Options Analyzer
- VectorVest ProGraphics v6.0
- VectorVest ProTrader 7
- VectorVest RealTime Derby Tool
- VectorVest Simulator
- VectorVest Variator
- VectorVest Watchdog
