HOT TOPICS LIST
- MACD
- Fibonacci
- RSI
- Gann
- ADXR
- Stochastics
- Volume
- Triangles
- Futures
- Cycles
- Volatility
- ZIGZAG
- MESA
- Retracement
- Aroon
INDICATORS LIST
LIST OF TOPICS
PRINT THIS ARTICLE
by Gary Grosschadl
Microsoft slid under its 200-day moving average on higher than average volume. That should send alarm bells ringing.
Position: Sell
Gary Grosschadl
Independent Canadian equities trader and technical analyst based in Peterborough
Ontario, Canada.
PRINT THIS ARTICLE
ANDREWS PITCH-FORK
Microsoft Trend Change
02/17/04 11:52:51 AMby Gary Grosschadl
Microsoft slid under its 200-day moving average on higher than average volume. That should send alarm bells ringing.
Position: Sell
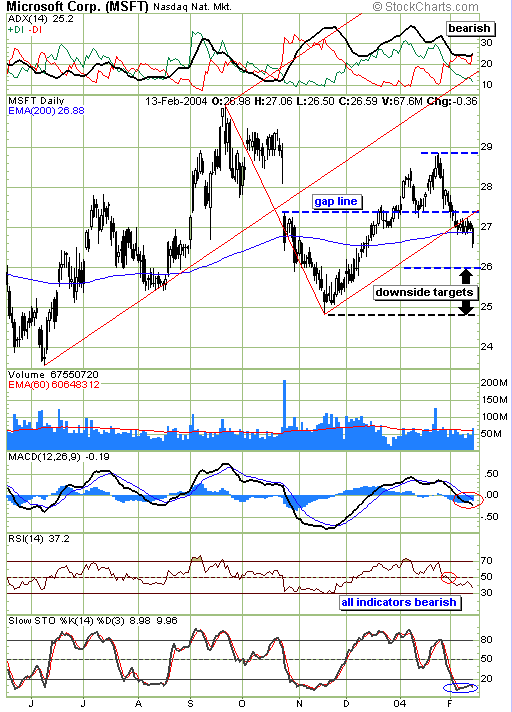
| This daily chart shows two earlier warning signs prior to Microsoft's dip under its 200-day moving average. The first was a move under the gap line in February. This line marks previous resistance turned support and also can be viewed as the troughline of a skewed double top formation. The next warning came via a move below the pitchfork or Andrews Line days later. The bullish pointing pitchfork, once broken to the downside, indicates a change in trend. A surprise move back inside the pitchfork seems unlikely as too much time has passed and the last trading session ended on a rather sour note. |
| Two possible downside targets are shown. The first at $26 represents a measured downside move equal to the distance between the previous top at the dashed line and the troughline. The lower $24.80 target would be a test of the former low. |

|
| A move below the pitchfork suggests a change in trend on this daily chart for MSFT. |
| Graphic provided by: Stockcharts.com. |
| |
| The displayed indicators are all in bearish mode. The DMI or directional movement index shows a bearish set-up with -DI above +DI and the ADX line above 25, suggesting growing trend strength for the bears. The MACD (moving average convergence/divergence) shows a bearish move below the zero line similar to the RSI (relative strength index) weakening below its 50 level. The stochastic indicator, although in oversold territory, has yet to show a move above the 20 level so there is no sign of any bullish reversal. |
| The outlook is bearish for Microsoft and if it does pull off a surprise reversal attempt, it has three upside tests to overcome: the 200-day moving average, the lower median line (pitchfork), and the previous gap line. |
Independent Canadian equities trader and technical analyst based in Peterborough
Ontario, Canada.
| Website: | www.whatsonsale.ca/financial.html |
| E-mail address: | gwg7@sympatico.ca |
Click here for more information about our publications!
Comments
Date: 02/17/04Rank: 5Comment:
Date: 02/17/04Rank: 5Comment: Yes, I ll say! Not a good sign at all from a company with over $50 billion in cash.
Cheers!
Matt Blackman

Request Information From Our Sponsors
- StockCharts.com, Inc.
- Candle Patterns
- Candlestick Charting Explained
- Intermarket Technical Analysis
- John Murphy on Chart Analysis
- John Murphy's Chart Pattern Recognition
- John Murphy's Market Message
- MurphyExplainsMarketAnalysis-Intermarket Analysis
- MurphyExplainsMarketAnalysis-Visual Analysis
- StockCharts.com
- Technical Analysis of the Financial Markets
- The Visual Investor
- VectorVest, Inc.
- Executive Premier Workshop
- One-Day Options Course
- OptionsPro
- Retirement Income Workshop
- Sure-Fire Trading Systems (VectorVest, Inc.)
- Trading as a Business Workshop
- VectorVest 7 EOD
- VectorVest 7 RealTime/IntraDay
- VectorVest AutoTester
- VectorVest Educational Services
- VectorVest OnLine
- VectorVest Options Analyzer
- VectorVest ProGraphics v6.0
- VectorVest ProTrader 7
- VectorVest RealTime Derby Tool
- VectorVest Simulator
- VectorVest Variator
- VectorVest Watchdog
