HOT TOPICS LIST
- MACD
- Fibonacci
- RSI
- Gann
- ADXR
- Stochastics
- Volume
- Triangles
- Futures
- Cycles
- Volatility
- ZIGZAG
- MESA
- Retracement
- Aroon
INDICATORS LIST
LIST OF TOPICS
PRINT THIS ARTICLE
by Gary Grosschadl
This widely followed index of gold stocks finds itself at a level where the next move can go either way.
Position: Hold
Gary Grosschadl
Independent Canadian equities trader and technical analyst based in Peterborough
Ontario, Canada.
PRINT THIS ARTICLE
CHART ANALYSIS
XAU Gold Index Caught Between Support And Resistance
02/17/04 11:54:51 AMby Gary Grosschadl
This widely followed index of gold stocks finds itself at a level where the next move can go either way.
Position: Hold
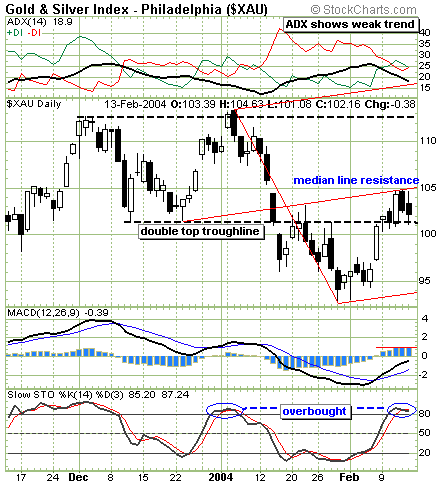
| The bigger picture on this daily chart shows the XAU coming off a double top from 113, breaking below its troughline to a low of 93. The subsequent bounce carried it above that previous troughline. |
| Using three prominent turning points, a pitchfork was added to get another perspective of support and resistance. The pitchfork shows a successful move to the median line and now this line appears to act as likely resistance. This pitchfork also suggests a move down is possible. However as long as the lower median line holds, the next move could be sideways, fluctuating between the middle and lower pitchfork tines. Should the troughline hold support then a tighter consolidation could result in another bullish foray to test the overhead median line. A surprise super bull move could result in a move to the upper median line but this likely could take some time in developing. |

|
| Daily chart shows support and resistance possibilities. |
| Graphic provided by: Stockcharts.com. |
| |
| The three indicators displayed reflect this current problem of resistance. The ADX line (at the topmost graph) is weak and still trending down, indicating a lack of trend strength. The MACD (moving average convergence/divergence) indicator shows a previous bullish crossover but as its histogram shows, this move may have topped out as far as this indicator is concerned. This looks to keep the MACD line from making a bullish cross of the zero line. Finally the stochastics indicator shows an overbought level above 80. A move below the 80 level would likely be bearish confirmation that a stochastic downleg is in order. |
| In summary, the next bigger move could be determined by a crossing of either threshold. A move below the dotted troughline likely brings a test of previous support while a move above the median line brings very bullish possibilities, perhaps leading to a test of previous highs. |
Independent Canadian equities trader and technical analyst based in Peterborough
Ontario, Canada.
| Website: | www.whatsonsale.ca/financial.html |
| E-mail address: | gwg7@sympatico.ca |
Click here for more information about our publications!
Comments
Date: 02/17/04Rank: 5Comment:

|

Request Information From Our Sponsors
- VectorVest, Inc.
- Executive Premier Workshop
- One-Day Options Course
- OptionsPro
- Retirement Income Workshop
- Sure-Fire Trading Systems (VectorVest, Inc.)
- Trading as a Business Workshop
- VectorVest 7 EOD
- VectorVest 7 RealTime/IntraDay
- VectorVest AutoTester
- VectorVest Educational Services
- VectorVest OnLine
- VectorVest Options Analyzer
- VectorVest ProGraphics v6.0
- VectorVest ProTrader 7
- VectorVest RealTime Derby Tool
- VectorVest Simulator
- VectorVest Variator
- VectorVest Watchdog
- StockCharts.com, Inc.
- Candle Patterns
- Candlestick Charting Explained
- Intermarket Technical Analysis
- John Murphy on Chart Analysis
- John Murphy's Chart Pattern Recognition
- John Murphy's Market Message
- MurphyExplainsMarketAnalysis-Intermarket Analysis
- MurphyExplainsMarketAnalysis-Visual Analysis
- StockCharts.com
- Technical Analysis of the Financial Markets
- The Visual Investor
