HOT TOPICS LIST
- MACD
- Fibonacci
- RSI
- Gann
- ADXR
- Stochastics
- Volume
- Triangles
- Futures
- Cycles
- Volatility
- ZIGZAG
- MESA
- Retracement
- Aroon
INDICATORS LIST
LIST OF TOPICS
PRINT THIS ARTICLE
by Arthur Hill
There are resistance zones and then there are big resistance zones. After a 3288 point advance in less than a year (7417 to 10705), the Dow has reached a big resistance zone and further upside is going to be a challenge to say the least.
Position: N/A
Arthur Hill
Arthur Hill is currently editor of TDTrader.com, a website specializing in trading strategies, sector/industry specific breadth stats and overall technical analysis. He passed the Society of Technical Analysts (STA London) diploma exam with distinction is a Certified Financial Technician (CFTe). Prior to TD Trader, he was the Chief Technical Analyst for Stockcharts.com and the main contributor to the ChartSchool.
PRINT THIS ARTICLE
TECHNICAL ANALYSIS
Dow Reaches Major Resistance
02/13/04 01:08:27 PMby Arthur Hill
There are resistance zones and then there are big resistance zones. After a 3288 point advance in less than a year (7417 to 10705), the Dow has reached a big resistance zone and further upside is going to be a challenge to say the least.
Position: N/A
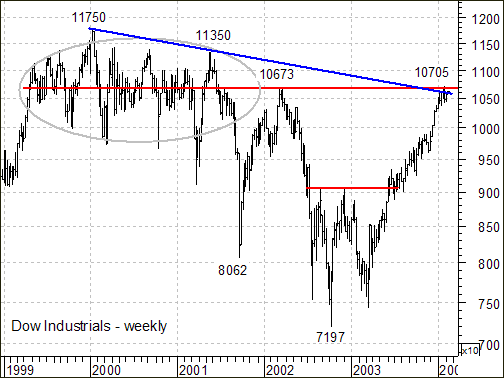
 Figure 1: Weekly chart of the Dow. As this weekly chart shows, the Dow traded above and below 10700 from April 1999 to August 2001 (gray oval). It was like one large distribution before the two sharp declines. The first decline was to 8062 and the other to 7197. After recording these lows, the subsequent advances were equally as sharp. The first advance carried to 10673 and the second or current advance to 10705. Even though the current advance has yet to fully reverse, resistance around 10700 is confirmed by the trendline extending down from 11750, the April 1999 to August 2001 consolidation and the March 2002 reaction high (10673). |
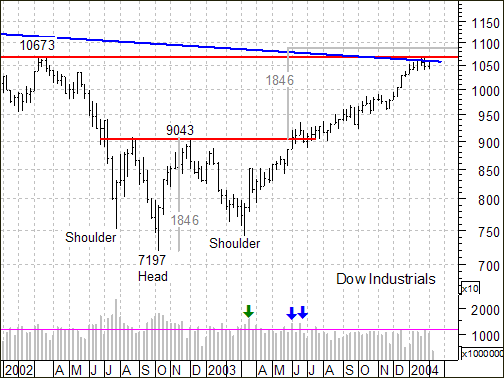
| The Dow is also approaching the head and shoulders target at 10889. The average formed a large head and shoulders pattern from July 2002 to May 2003, almost a one year base. The neckline breakout at 9043 confirmed the pattern and projected further strength to around 10889 (9043 - 7197 = 1846, 9043 + 1846 = 10889). With the Dow currently around 10600, this suggests 300 points or so to the upside. |

|
| Figure 2: Head and shoulders formation on the Dow. |
| Graphic provided by: MetaStock. |
| |
| With the Dow up over 3000 points without a correction, within 300 points of the head and shoulders target and entering a large resistance zone, new longs positions look risky. In addition, volume patterns are not encouraging. The advance began with relatively strong volume (green arrow) and the breakout even featured a couple weeks of above average volume (blue arrows). However, volume since August has been below average and shows waning interest at higher prices. |
Arthur Hill is currently editor of TDTrader.com, a website specializing in trading strategies, sector/industry specific breadth stats and overall technical analysis. He passed the Society of Technical Analysts (STA London) diploma exam with distinction is a Certified Financial Technician (CFTe). Prior to TD Trader, he was the Chief Technical Analyst for Stockcharts.com and the main contributor to the ChartSchool.
| Title: | Editor |
| Company: | TDTrader.com |
| Address: | Willem Geetsstraat 17 |
| Mechelen, B2800 | |
| Phone # for sales: | 3215345465 |
| Website: | www.tdtrader.com |
| E-mail address: | arthurh@tdtrader.com |
Traders' Resource Links | |
| TDTrader.com has not added any product or service information to TRADERS' RESOURCE. | |
Click here for more information about our publications!
Comments
Date: 02/13/04Rank: 5Comment:
Date: 02/15/04Rank: 4Comment:
Date: 02/18/04Rank: 4Comment:
Date: 02/18/04Rank: 5Comment:
Date: 05/16/04Rank: 5Comment:

Request Information From Our Sponsors
- StockCharts.com, Inc.
- Candle Patterns
- Candlestick Charting Explained
- Intermarket Technical Analysis
- John Murphy on Chart Analysis
- John Murphy's Chart Pattern Recognition
- John Murphy's Market Message
- MurphyExplainsMarketAnalysis-Intermarket Analysis
- MurphyExplainsMarketAnalysis-Visual Analysis
- StockCharts.com
- Technical Analysis of the Financial Markets
- The Visual Investor
- VectorVest, Inc.
- Executive Premier Workshop
- One-Day Options Course
- OptionsPro
- Retirement Income Workshop
- Sure-Fire Trading Systems (VectorVest, Inc.)
- Trading as a Business Workshop
- VectorVest 7 EOD
- VectorVest 7 RealTime/IntraDay
- VectorVest AutoTester
- VectorVest Educational Services
- VectorVest OnLine
- VectorVest Options Analyzer
- VectorVest ProGraphics v6.0
- VectorVest ProTrader 7
- VectorVest RealTime Derby Tool
- VectorVest Simulator
- VectorVest Variator
- VectorVest Watchdog
