HOT TOPICS LIST
- MACD
- Fibonacci
- RSI
- Gann
- ADXR
- Stochastics
- Volume
- Triangles
- Futures
- Cycles
- Volatility
- ZIGZAG
- MESA
- Retracement
- Aroon
INDICATORS LIST
LIST OF TOPICS
PRINT THIS ARTICLE
by Matt Blackman
With a number of factors in its favor, not the least of which is upward pressure on oil prices, is this stock getting ready to break out?
Position: N/A
Matt Blackman
Matt Blackman is a full-time technical and financial writer and trader. He produces corporate and financial newsletters, and assists clients in getting published in the mainstream media. He is the host of TradeSystemGuru.com. Matt has earned the Chartered Market Technician (CMT) designation. Find out what stocks and futures Matt is watching on Twitter at www.twitter.com/RatioTrade
PRINT THIS ARTICLE
TRITOP/TRI BOTTOM
Diamond Offshore Getting Ready To Blow?
02/12/04 09:42:00 AMby Matt Blackman
With a number of factors in its favor, not the least of which is upward pressure on oil prices, is this stock getting ready to break out?
Position: N/A
| On the eve of the Iraq War, light crude hit a high of $38.14 on March 13, 2003. But as the bombs began to fall on Baghdad, oil prices fell along with them, dropping into the $25 range by mid-April. It was the spark that caused the combustion of a new bull market. |

|
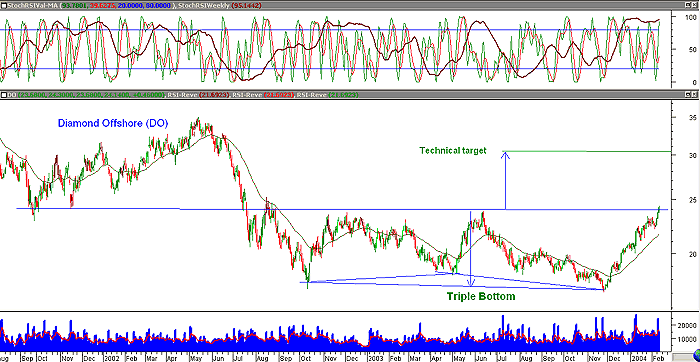
| Figure 1 – Daily chart of Diamond Offshore (DO) putting in a slow but steady triple bottom chart pattern. It just broke above the neckline at around $24 on good volume. Based on the pattern the projected target is $30.45. The upper window shows the daily and weekly stochasticRSI. Chart by Recognia.com. |
| Graphic provided by: Recognia.com. |
| |
| But April 29, 2003 was the low on the dipstick for oil prices at $25.04 and since then they have been slowly but methodically climbing higher. They hit a high of just over $36 once more in late January and are showing signs of a continued upside move. |
| John Murphy began talking about oil sector stocks showing strength a number of weeks ago in his Murphy Market Message Newsletter. As he has said in the past, oil prices of $40/barrel bode ill for the health of the economy, and historically every time this price has come close, a US recession has followed. Oil sector stocks are also usually the last in the recovery train and are a sure sign that the economy has reached a peak of sorts. Whether that is true this time remains to be seen but oil stocks are steadily climbing higher on the prospect of sustained elevated prices in the commodity. From a fundamental standpoint, Diamond Offshore is no great shakes. Earnings just turned positive in December 03 for the first time in a year, which may indicate that the company needs oil prices above $25/barrel to make money. Even based on forward earnings the price-to-earnings ratio is high at 85. But fundamentals aside, this could be an interesting oil price play and if the chart pattern is any indication, it looks like oil and DO are heading higher. SUGGESTED READING: Murphy, John [2004] Intermarket Analysis, John Wiley & Sons |
Matt Blackman is a full-time technical and financial writer and trader. He produces corporate and financial newsletters, and assists clients in getting published in the mainstream media. He is the host of TradeSystemGuru.com. Matt has earned the Chartered Market Technician (CMT) designation. Find out what stocks and futures Matt is watching on Twitter at www.twitter.com/RatioTrade
| Company: | TradeSystemGuru.com |
| Address: | Box 2589 |
| Garibaldi Highlands, BC Canada | |
| Phone # for sales: | 604-898-9069 |
| Fax: | 604-898-9069 |
| Website: | www.tradesystemguru.com |
| E-mail address: | indextradermb@gmail.com |
Traders' Resource Links | |
| TradeSystemGuru.com has not added any product or service information to TRADERS' RESOURCE. | |
Click here for more information about our publications!
PRINT THIS ARTICLE

Request Information From Our Sponsors
- StockCharts.com, Inc.
- Candle Patterns
- Candlestick Charting Explained
- Intermarket Technical Analysis
- John Murphy on Chart Analysis
- John Murphy's Chart Pattern Recognition
- John Murphy's Market Message
- MurphyExplainsMarketAnalysis-Intermarket Analysis
- MurphyExplainsMarketAnalysis-Visual Analysis
- StockCharts.com
- Technical Analysis of the Financial Markets
- The Visual Investor
- VectorVest, Inc.
- Executive Premier Workshop
- One-Day Options Course
- OptionsPro
- Retirement Income Workshop
- Sure-Fire Trading Systems (VectorVest, Inc.)
- Trading as a Business Workshop
- VectorVest 7 EOD
- VectorVest 7 RealTime/IntraDay
- VectorVest AutoTester
- VectorVest Educational Services
- VectorVest OnLine
- VectorVest Options Analyzer
- VectorVest ProGraphics v6.0
- VectorVest ProTrader 7
- VectorVest RealTime Derby Tool
- VectorVest Simulator
- VectorVest Variator
- VectorVest Watchdog
