HOT TOPICS LIST
- MACD
- Fibonacci
- RSI
- Gann
- ADXR
- Stochastics
- Volume
- Triangles
- Futures
- Cycles
- Volatility
- ZIGZAG
- MESA
- Retracement
- Aroon
INDICATORS LIST
LIST OF TOPICS
PRINT THIS ARTICLE
by Gary Grosschadl
Dell may be toying with a head and shoulders top but for now it has gained the upper hand.
Position: Hold
Gary Grosschadl
Independent Canadian equities trader and technical analyst based in Peterborough
Ontario, Canada.
PRINT THIS ARTICLE
CHART ANALYSIS
A Dilemma For Dell
02/12/04 09:29:15 AMby Gary Grosschadl
Dell may be toying with a head and shoulders top but for now it has gained the upper hand.
Position: Hold
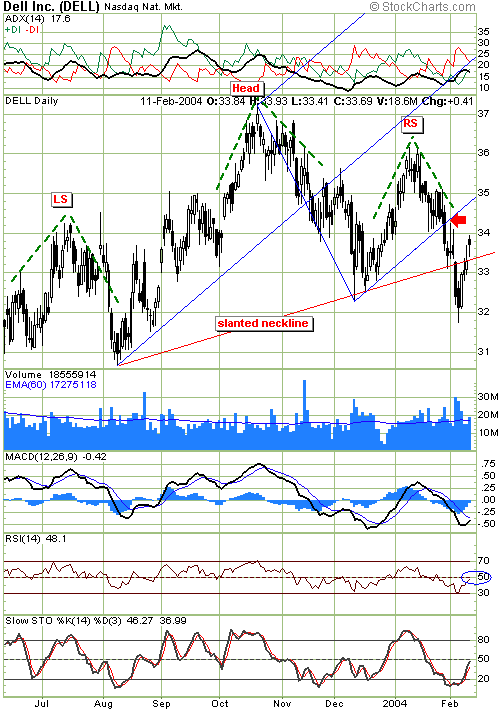
| This daily chart shows two noteworthy patterns. A large blue pitchfork or Andrews Line and a possible head and shoulders top. After the three pivot points were established, the pitchfork pointed bullishly up and the uptrend remained in place until the bottom line (lower median line) was broken at the red arrow. This resulted in a move down to test the slanted neckline of the head and shoulders pattern. Note how after the neckline was first touched, a short lived retest of that lower median line was attempted. A reversal ensued at $32 and the neckline was breached to the upside. The question now is whether this a rejection of the head and shoulders top or just a temporary reprieve. |
| Right now the way is not clear so it remains a wait and see scenario. A bullish move back inside the pitchfork could mean a resumption of the uptrend, however a move below the neckline could trigger a measured decline down to $28.40. This is approximately a $5 decline from the neckline, representing the vertical distance from the top to the neckline and then applied to the downside. |

|
| Dell's daily view suggests it is caught between a pitchfork and a head and shoulders neckline. |
| Graphic provided by: Stockcharts.com. |
| |
| Several indicators are worth mentioning. The DMI or directional movement indicator at the top of the chart shows a bearish state -- the DIs have not crossed, with the -DI being above +DI. The MACD or moving average convergence/divergence shows an apparent turn in the making but still needs to cross over its signal line to give a bullish signal. The remaining two indicators (RSI and stochastics) have turned bullishly up but have yet to pass above their 50 levels which can often act as potential stall zones. |
| In summary watch those two lines to confirm whether the bulls take charge or the bears prevail. The bulls want to move back inside the blue pitchfork while the bears look to pounce should the neckline be punctured to the downside again. |
Independent Canadian equities trader and technical analyst based in Peterborough
Ontario, Canada.
| Website: | www.whatsonsale.ca/financial.html |
| E-mail address: | gwg7@sympatico.ca |
Click here for more information about our publications!
PRINT THIS ARTICLE

Request Information From Our Sponsors
- StockCharts.com, Inc.
- Candle Patterns
- Candlestick Charting Explained
- Intermarket Technical Analysis
- John Murphy on Chart Analysis
- John Murphy's Chart Pattern Recognition
- John Murphy's Market Message
- MurphyExplainsMarketAnalysis-Intermarket Analysis
- MurphyExplainsMarketAnalysis-Visual Analysis
- StockCharts.com
- Technical Analysis of the Financial Markets
- The Visual Investor
- VectorVest, Inc.
- Executive Premier Workshop
- One-Day Options Course
- OptionsPro
- Retirement Income Workshop
- Sure-Fire Trading Systems (VectorVest, Inc.)
- Trading as a Business Workshop
- VectorVest 7 EOD
- VectorVest 7 RealTime/IntraDay
- VectorVest AutoTester
- VectorVest Educational Services
- VectorVest OnLine
- VectorVest Options Analyzer
- VectorVest ProGraphics v6.0
- VectorVest ProTrader 7
- VectorVest RealTime Derby Tool
- VectorVest Simulator
- VectorVest Variator
- VectorVest Watchdog
