HOT TOPICS LIST
- MACD
- Fibonacci
- RSI
- Gann
- ADXR
- Stochastics
- Volume
- Triangles
- Futures
- Cycles
- Volatility
- ZIGZAG
- MESA
- Retracement
- Aroon
INDICATORS LIST
LIST OF TOPICS
PRINT THIS ARTICLE
by Kevin Hopson
Transocean Inc. recently broke out of a long-term bottoming pattern, indicating significantly higher prices down the road.
Position: Accumulate
Kevin Hopson
Kevin has been a technical analyst for roughly 10 years now. Previously, Kevin owned his own business and acted as a registered investment advisor, specializing in energy. He was also a freelance oil analyst for Orient Trading Co., a commodity futures trading firm in Japan. Kevin is currently a freelance writer.
PRINT THIS ARTICLE
CHANNEL LINES
Transocean's Long-Term Channel Breakout
02/12/04 09:03:30 AMby Kevin Hopson
Transocean Inc. recently broke out of a long-term bottoming pattern, indicating significantly higher prices down the road.
Position: Accumulate
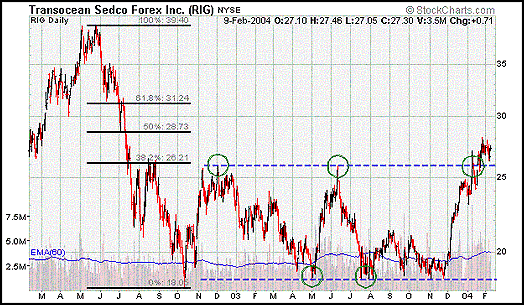
| Transocean Inc. (RIG) had been stuck in a trading range between $18.50 and $26.00 for a year-and-a-half before breaking out in early January. Trading ranges (or channels) tend to act as continuation patterns. However, Transocean used this channel formation as a long-term bottoming pattern, as the stock broke to the upside instead of moving lower. I will touch on the ramifications of this move in just a minute. In the meantime, I would like to bring your attention to a key Fibonacci retracement level. |
| Looking at the two-year chart for Transocean, you will notice that the 38.2 percent retracement level ($26.21) from the May '02 to October '02 decline acted as resistance for the stock for over a year. In fact, this retracement level effectively formed the top of Transocean's long-term trading range. As a result, when Transocean broke above this level in January, it was a very bullish sign for the stock. As you can see, the stock is quickly approaching the 50 percent retracement level ($28.73), which could act as a turning point (resistance) in the near-term. |

|
| Graphic provided by: Stockcharts.com. |
| |
| However, a pullback could be in the best interest of long-term shareholders as the long-term upside potential is still significant. Specifically, the trading range breakout indicates a possible upside target between $41.00 and $48.50. This is calculated by taking the number of times the stock tested the upper channel line in alternate sequence (3), multiplying it by the width of the trading range ($26.00 - $18.50 = $7.50), and then adding this figure ($7.50 x 3 = $22.50) to the bottom ($18.50 + $22.50 = $41.00) and top ($26.00 + $22.50 = $48.50) channel lines. |
| Market sentiment towards the stock remains overly pessimistic too. Short interest has increased from 9.0M shares to 15.1M shares over the past two months and the number of analysts with "buy" ratings on the stock has decreased from 48 percent to 37 percent. This is definitely not the type of activity you would normally see at a market top. As a result, I would look to accumulate shares of Transocean on any near-term weakness. In the meantime, if the stock can overcome Fibonacci resistance around $28.73, look for a further rally to the $31.24 level in the near-term. |
Kevin has been a technical analyst for roughly 10 years now. Previously, Kevin owned his own business and acted as a registered investment advisor, specializing in energy. He was also a freelance oil analyst for Orient Trading Co., a commodity futures trading firm in Japan. Kevin is currently a freelance writer.
| Glen Allen, VA | |
| E-mail address: | hopson_1@yahoo.com |
Click here for more information about our publications!
PRINT THIS ARTICLE

Request Information From Our Sponsors
- StockCharts.com, Inc.
- Candle Patterns
- Candlestick Charting Explained
- Intermarket Technical Analysis
- John Murphy on Chart Analysis
- John Murphy's Chart Pattern Recognition
- John Murphy's Market Message
- MurphyExplainsMarketAnalysis-Intermarket Analysis
- MurphyExplainsMarketAnalysis-Visual Analysis
- StockCharts.com
- Technical Analysis of the Financial Markets
- The Visual Investor
- VectorVest, Inc.
- Executive Premier Workshop
- One-Day Options Course
- OptionsPro
- Retirement Income Workshop
- Sure-Fire Trading Systems (VectorVest, Inc.)
- Trading as a Business Workshop
- VectorVest 7 EOD
- VectorVest 7 RealTime/IntraDay
- VectorVest AutoTester
- VectorVest Educational Services
- VectorVest OnLine
- VectorVest Options Analyzer
- VectorVest ProGraphics v6.0
- VectorVest ProTrader 7
- VectorVest RealTime Derby Tool
- VectorVest Simulator
- VectorVest Variator
- VectorVest Watchdog
