HOT TOPICS LIST
- MACD
- Fibonacci
- RSI
- Gann
- ADXR
- Stochastics
- Volume
- Triangles
- Futures
- Cycles
- Volatility
- ZIGZAG
- MESA
- Retracement
- Aroon
INDICATORS LIST
LIST OF TOPICS
PRINT THIS ARTICLE
by Koos van der Merwe
When Nortel broke out of its consolidation triangle (see "Nortel, Something To Look At?" December 23, 2003), the profits that were made on a buy signal were excellent. Is Lucent now offering the same opportunity?
Position: N/A
Koos van der Merwe
Has been a technical analyst since 1969, and has worked as a futures and options trader with First Financial Futures in Johannesburg, South Africa.
PRINT THIS ARTICLE
TRIANGLES
Is Lucent Worth Watching?
02/10/04 01:35:28 PMby Koos van der Merwe
When Nortel broke out of its consolidation triangle (see "Nortel, Something To Look At?" December 23, 2003), the profits that were made on a buy signal were excellent. Is Lucent now offering the same opportunity?
Position: N/A
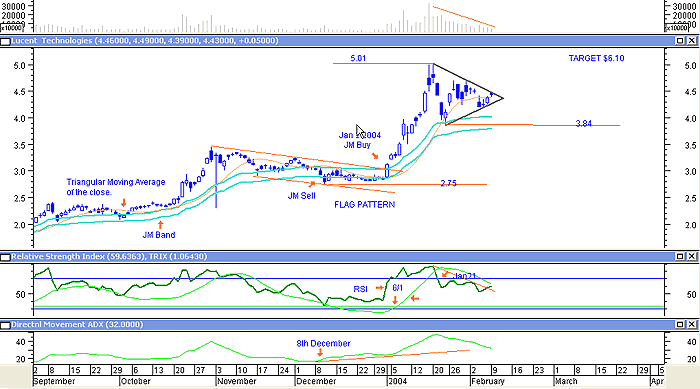
| This is a candlestick chart of Lucent Technologies from September 2, 2003 to February 9, 2004. The chart shows how strongly Lucent broke out of the flag pattern upwards. At the moment it is stalled in a triangular pattern - a consolidation phase - which, if broken on the upper boundary, will suggest a target of $6.10. |
| The price at the time of writing has not broken above the triangle's resistance line. It is now at $4.36, having fallen 0.07 (February 10, 11:00 am). What are its chances of breaking above this resistance, and giving a buy signal? On January 2nd the chart not only broke above the upper JM band line giving a buy signal, but it also broke above the upper resistance line of the flag pattern. This was done even though the RSI indicator was at overbought levels. The price actually broke above the triangular moving average the day before, so I would have been warned. |

|
| Lucent Technologies. |
| Graphic provided by: MetaStock. |
| |
| The JM internal band is a 15-unit simple moving average offset by 2% upwards and -2% downwards. The buy signal given by the JM band line would have been supported by the positive bias in the ADX line which started to move up on December 8th. On January 21st, the RSI indicator gave a sell signal. This was after the price reached a high of $5.01 and started falling. Both the TRIX indicator and the ADX line turned negative and traders probably would have been closed out of the position on a rising stop-loss. |
| Indicator signals have therefore been sound. The RSI has broken above its resistance line, suggesting a possible up-move. This has not been confirmed by the ADX line nor the TRIX indicator. Volume has been falling as the price traces out its triangle, a possible sign of strength, as both sellers and buyers are drying up, and holding the stock in anticipation. Now traders should wait for a definite break out of the upper resistance line of the consolidation triangle, confirmed by indicators. The triangle could resolve itself by turning into a pennant or flag if weakness persists. Volume is a decisive factor,and should be watched. |
| To conclude, Lucent is a stock to watch for a probable breakout upwards sometime in the near future. |
Has been a technical analyst since 1969, and has worked as a futures and options trader with First Financial Futures in Johannesburg, South Africa.
| Address: | 3256 West 24th Ave |
| Vancouver, BC | |
| Phone # for sales: | 6042634214 |
| E-mail address: | petroosp@gmail.com |
Click here for more information about our publications!
Comments
Date: 02/11/04Rank: 4Comment:
Date: 02/15/04Rank: 5Comment:

|

Request Information From Our Sponsors
- StockCharts.com, Inc.
- Candle Patterns
- Candlestick Charting Explained
- Intermarket Technical Analysis
- John Murphy on Chart Analysis
- John Murphy's Chart Pattern Recognition
- John Murphy's Market Message
- MurphyExplainsMarketAnalysis-Intermarket Analysis
- MurphyExplainsMarketAnalysis-Visual Analysis
- StockCharts.com
- Technical Analysis of the Financial Markets
- The Visual Investor
- VectorVest, Inc.
- Executive Premier Workshop
- One-Day Options Course
- OptionsPro
- Retirement Income Workshop
- Sure-Fire Trading Systems (VectorVest, Inc.)
- Trading as a Business Workshop
- VectorVest 7 EOD
- VectorVest 7 RealTime/IntraDay
- VectorVest AutoTester
- VectorVest Educational Services
- VectorVest OnLine
- VectorVest Options Analyzer
- VectorVest ProGraphics v6.0
- VectorVest ProTrader 7
- VectorVest RealTime Derby Tool
- VectorVest Simulator
- VectorVest Variator
- VectorVest Watchdog
