HOT TOPICS LIST
- MACD
- Fibonacci
- RSI
- Gann
- ADXR
- Stochastics
- Volume
- Triangles
- Futures
- Cycles
- Volatility
- ZIGZAG
- MESA
- Retracement
- Aroon
INDICATORS LIST
LIST OF TOPICS
PRINT THIS ARTICLE
by Gary Grosschadl
Boeing (BA) has bounced a few days ahead of the airline index and now finds itself challenging a previous top.
Position: Sell
Gary Grosschadl
Independent Canadian equities trader and technical analyst based in Peterborough
Ontario, Canada.
PRINT THIS ARTICLE
CHART ANALYSIS
Boeing Looks Toppy
02/09/04 08:53:19 AMby Gary Grosschadl
Boeing (BA) has bounced a few days ahead of the airline index and now finds itself challenging a previous top.
Position: Sell
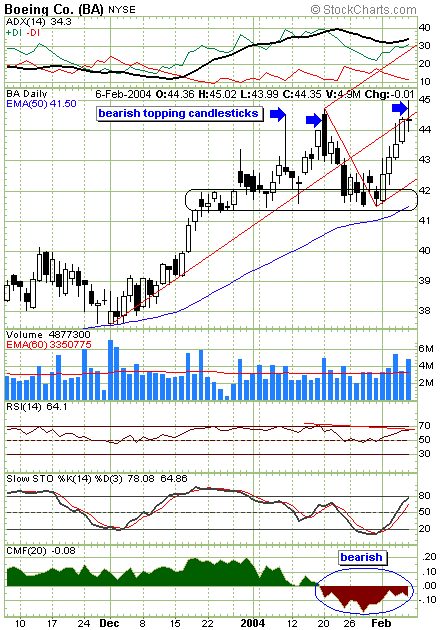
| Boeing's daily chart below suggests a recent pattern of candlestick failures at recent tops. The first was a shooting star candlestick that illustrates how the bulls could not sustain the high of the day in question. The next top was hit with a bearish engulfing candlestick that also drove the stock down in the short-term. Each retracement found support at a previous congestion zone. Now another top warning is present via a doji candlestick. A doji at the top or bottom of a run often is a reliable reversal pattern, however confirmation is normally required to verify the bearish intent. A surprise move past the doji negates this. |
| A pitchfork or Andrews Line has been added to the chart to show support and resistance possibilities. The bullish pointing pitchfork shows a successful move to the median (center) line. It would take a super bull move to advance to the upper pitchfork. A move back down to test the lower line is another possibility. A close below this lower line could be an important test. as the previous congestion zone resides there as does the 50-day EMA. For this reason, the sell position I indicate applies only to short-term traders as another bounce between $41 - $42 is a distinct possibility. |

|
| Boeing's daily chart shows another potential short-term top. |
| Graphic provided by: Stockcharts.com. |
| |
| Several indicators are worth mentioning. The ADX line at the top of the chart shows the bullish trend is strong, however being above the +DI line is a potential danger sign and the trend could be overheating. The CMF indicator or Chaiken money flow shows a rather bearish graph. This supply/demand type indicator has not recovered into a positive mode even though the stock has charged higher. This indicates poor conviction by the bulls and also serves as a sign of bearish divergence to price action. |
| In summary, if this doji candlestick confirms to the downside, a move back down to test previous support is a good possibility. A close below the lower pitchfork line could serve as a warning that the congestion zone and the 50-day EMA may not hold support, but this remains to be seen. |
Independent Canadian equities trader and technical analyst based in Peterborough
Ontario, Canada.
| Website: | www.whatsonsale.ca/financial.html |
| E-mail address: | gwg7@sympatico.ca |
Click here for more information about our publications!
PRINT THIS ARTICLE

Request Information From Our Sponsors
- StockCharts.com, Inc.
- Candle Patterns
- Candlestick Charting Explained
- Intermarket Technical Analysis
- John Murphy on Chart Analysis
- John Murphy's Chart Pattern Recognition
- John Murphy's Market Message
- MurphyExplainsMarketAnalysis-Intermarket Analysis
- MurphyExplainsMarketAnalysis-Visual Analysis
- StockCharts.com
- Technical Analysis of the Financial Markets
- The Visual Investor
- VectorVest, Inc.
- Executive Premier Workshop
- One-Day Options Course
- OptionsPro
- Retirement Income Workshop
- Sure-Fire Trading Systems (VectorVest, Inc.)
- Trading as a Business Workshop
- VectorVest 7 EOD
- VectorVest 7 RealTime/IntraDay
- VectorVest AutoTester
- VectorVest Educational Services
- VectorVest OnLine
- VectorVest Options Analyzer
- VectorVest ProGraphics v6.0
- VectorVest ProTrader 7
- VectorVest RealTime Derby Tool
- VectorVest Simulator
- VectorVest Variator
- VectorVest Watchdog
