

HOT TOPICS LIST
- MACD
- Fibonacci
- RSI
- Gann
- ADXR
- Stochastics
- Volume
- Triangles
- Futures
- Cycles
- Volatility
- ZIGZAG
- MESA
- Retracement
- Aroon
INDICATORS LIST
LIST OF TOPICS
PRINT THIS ARTICLE
by Gary Grosschadl
Is the party over or is this a normal and healthy correction for the tech index?
Position: Hold
Gary Grosschadl
Independent Canadian equities trader and technical analyst based in Peterborough
Ontario, Canada.
PRINT THIS ARTICLE
CHART ANALYSIS
Nasdaq Headed For A Pattern Test
02/05/04 02:02:06 PMby Gary Grosschadl
Is the party over or is this a normal and healthy correction for the tech index?
Position: Hold
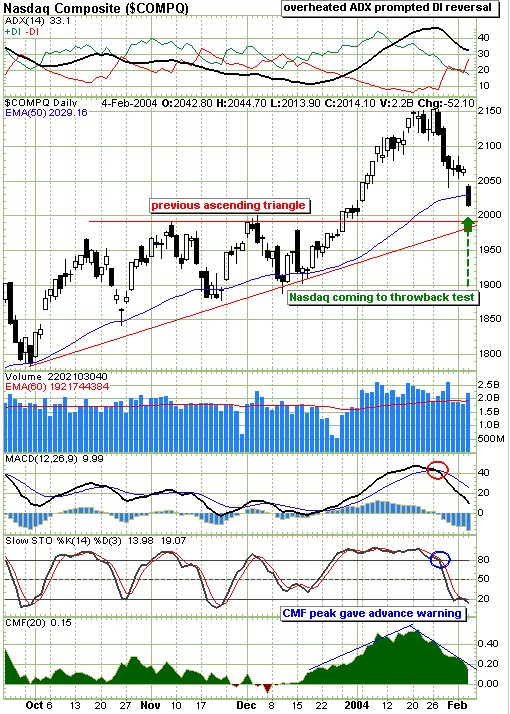
| In the last seven trading sessions the Nasdaq has given up most of its gains in 2004. However if this pattern analysis is correct, we are still in a bull phase and nearing a bounce. |
| This daily chart shows a probable throwback test of a former ascending triangle breakout formation. A throwback occurs when prices return to a former breakout price, such as a trendline break. There are three main characteristics that apply to throwbacks. First, the move must return reasonably close to the original breakout. Next, the move should be completed within 30 days (this is day 25 for this chart). Finally a large white space should be evident as the price action curls back to the previous trendline. An excellent article on this topic is "Making Cents of Throwbacks and Pullbacks" by Thomas Bulkowski, June 2002, Technical Analysis of STOCKS & COMMODITIES. |
|
| Nasdaq is quickly approaching a throwback test. |
| Graphic provided by: Stockcharts.com. |
| |
| Several indicators are worth mentioning here. The DMI or directional movement indicator (top of chart) shows how the ADX line became "overheated" as it climbed above +DI, peaked and reversed, signaling an upcoming change of trend. The DIs eventually crossed as confirmation, but for short-term traders, as soon as the ADX line reversed, a more timely signal was given regarding the coming downturn. The MACD (moving average convergence/divergence) gave a very timely signal with its bearish cross. Correspondingly the stochastics gave its own signal as it finally declined below the 80 level, this level often being the confirmation that overbought levels are no longer sustainable. The CMF or Chaiken money flow indicator also served the technical trader well as the peaking action warned of a downturn. |
| The good news is, if this pattern holds true, then a bounce is very close. A confident move north would imply that the bull phase for this index is not yet over and new highs may be attained. Likewise a failure of this ascending triangle to hold support could mean the party is over for now and more downside pain could follow. |
Independent Canadian equities trader and technical analyst based in Peterborough
Ontario, Canada.
| Website: | www.whatsonsale.ca/financial.html |
| E-mail address: | gwg7@sympatico.ca |
Click here for more information about our publications!
Comments
Date:�02/12/04Rank:�5Comment:�

Request Information From Our Sponsors
- StockCharts.com, Inc.
- Candle Patterns
- Candlestick Charting Explained
- Intermarket Technical Analysis
- John Murphy on Chart Analysis
- John Murphy's Chart Pattern Recognition
- John Murphy's Market Message
- MurphyExplainsMarketAnalysis-Intermarket Analysis
- MurphyExplainsMarketAnalysis-Visual Analysis
- StockCharts.com
- Technical Analysis of the Financial Markets
- The Visual Investor
- VectorVest, Inc.
- Executive Premier Workshop
- One-Day Options Course
- OptionsPro
- Retirement Income Workshop
- Sure-Fire Trading Systems (VectorVest, Inc.)
- Trading as a Business Workshop
- VectorVest 7 EOD
- VectorVest 7 RealTime/IntraDay
- VectorVest AutoTester
- VectorVest Educational Services
- VectorVest OnLine
- VectorVest Options Analyzer
- VectorVest ProGraphics v6.0
- VectorVest ProTrader 7
- VectorVest RealTime Derby Tool
- VectorVest Simulator
- VectorVest Variator
- VectorVest Watchdog