HOT TOPICS LIST
- MACD
- Fibonacci
- RSI
- Gann
- ADXR
- Stochastics
- Volume
- Triangles
- Futures
- Cycles
- Volatility
- ZIGZAG
- MESA
- Retracement
- Aroon
INDICATORS LIST
LIST OF TOPICS
PRINT THIS ARTICLE
by Kevin Hopson
Newmont Mining Corp. (NEM) has pulled back roughly 20 percent over the past month but there are signs of the short-term downtrend reversing.
Position: Hold
Kevin Hopson
Kevin has been a technical analyst for roughly 10 years now. Previously, Kevin owned his own business and acted as a registered investment advisor, specializing in energy. He was also a freelance oil analyst for Orient Trading Co., a commodity futures trading firm in Japan. Kevin is currently a freelance writer.
PRINT THIS ARTICLE
TECHNICAL ANALYSIS
Bullish Divergences For Newmont Mining Corp.
02/09/04 08:23:02 AMby Kevin Hopson
Newmont Mining Corp. (NEM) has pulled back roughly 20 percent over the past month but there are signs of the short-term downtrend reversing.
Position: Hold
| Newmont Mining Corp. has seen significant gains over the past year, as the stock has more than doubled since March '03. As a result, the recent pullback in the stock price - though sizeable - should not come as a surprise to most investors. After topping out around the $50.00 level early this year, Newmont has proceeded to pull back to the low $40s. So what now? Should investors stay on the sidelines, go long at current levels, or sell into strength? |
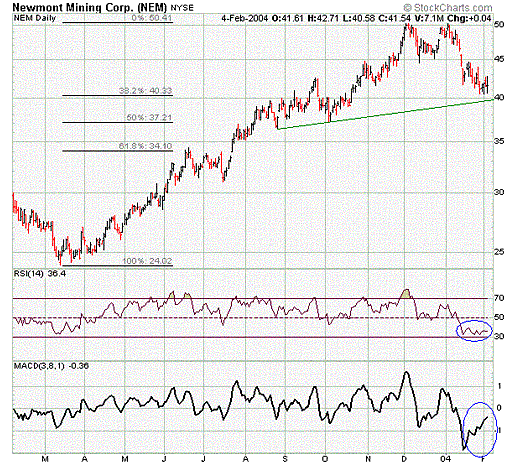
| Though the charts fail to offer a definitive conclusion, they provide some much needed insight on the situation. For example, looking at the one-year chart for Newmont, you will notice that the relative strength Index (RSI) has been moving sideways the last few weeks, while the moving average convergence/divergence (MACD) has been moving higher. This has occurred in light of lower prices, an indication that a bullish divergence has formed. Bullish divergences usually signal a forthcoming bottom reversal. |

|
| Figure 1: One-year chart of Newmont. |
| Graphic provided by: Stockcharts.com. |
| |
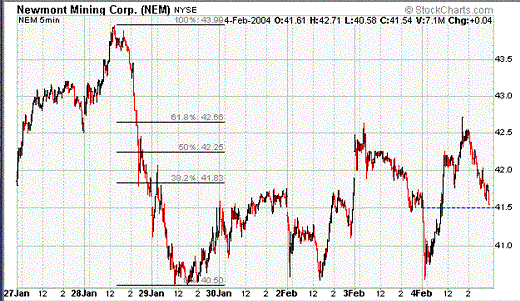
| However, Newmont will have to hold support in the $40.00 to $40.50 range to avoid a further sell-off in the near-term. As you can see in the one-year chart, the 38.2 percent retracement level from the March '03 to Jan. '04 rally comes in at $40.33, and last August's uptrend line comes into play around the $40.00 level. Switching to the seven-day chart, notice that the stock has bounced off the $40.50 level for several days in a row. As a result, I consider the $40.00 to $40.50 range a key support area for the stock. |
 Figure 2: Seven-day chart of Newmont. Additionally, Newmont has continued to find short-term resistance around the $42.70 level. This is the site of the 61.8 percent retracement level ($42.66) from the Jan. 28 high to the Jan. 29 low. Since 61.8 percent retracement levels often act as ultimate reversal points, a break of resistance here (say a move to $42.80) would turn the near-term technicals bullish. So, the stock could test the Jan. 28 high around $44.00. |
| In summary, if Newmont can hold support in the $40.00 to $40.50 range and overcome resistance at $42.70, a short-term bottom will likely be confirmed. Otherwise, a move below the $40.00 level could spur additional selling pressure in the near-term. |
Kevin has been a technical analyst for roughly 10 years now. Previously, Kevin owned his own business and acted as a registered investment advisor, specializing in energy. He was also a freelance oil analyst for Orient Trading Co., a commodity futures trading firm in Japan. Kevin is currently a freelance writer.
| Glen Allen, VA | |
| E-mail address: | hopson_1@yahoo.com |
Click here for more information about our publications!
Comments

Request Information From Our Sponsors
- VectorVest, Inc.
- Executive Premier Workshop
- One-Day Options Course
- OptionsPro
- Retirement Income Workshop
- Sure-Fire Trading Systems (VectorVest, Inc.)
- Trading as a Business Workshop
- VectorVest 7 EOD
- VectorVest 7 RealTime/IntraDay
- VectorVest AutoTester
- VectorVest Educational Services
- VectorVest OnLine
- VectorVest Options Analyzer
- VectorVest ProGraphics v6.0
- VectorVest ProTrader 7
- VectorVest RealTime Derby Tool
- VectorVest Simulator
- VectorVest Variator
- VectorVest Watchdog
- StockCharts.com, Inc.
- Candle Patterns
- Candlestick Charting Explained
- Intermarket Technical Analysis
- John Murphy on Chart Analysis
- John Murphy's Chart Pattern Recognition
- John Murphy's Market Message
- MurphyExplainsMarketAnalysis-Intermarket Analysis
- MurphyExplainsMarketAnalysis-Visual Analysis
- StockCharts.com
- Technical Analysis of the Financial Markets
- The Visual Investor
