HOT TOPICS LIST
- MACD
- Fibonacci
- RSI
- Gann
- ADXR
- Stochastics
- Volume
- Triangles
- Futures
- Cycles
- Volatility
- ZIGZAG
- MESA
- Retracement
- Aroon
INDICATORS LIST
LIST OF TOPICS
PRINT THIS ARTICLE
by Koos van der Merwe
The AMEX Gold BUGS Index says it is.
Position: Accumulate
Koos van der Merwe
Has been a technical analyst since 1969, and has worked as a futures and options trader with First Financial Futures in Johannesburg, South Africa.
PRINT THIS ARTICLE
ELLIOTT WAVE
Is Gold Ready To Test New Highs?
02/05/04 01:12:53 PMby Koos van der Merwe
The AMEX Gold BUGS Index says it is.
Position: Accumulate
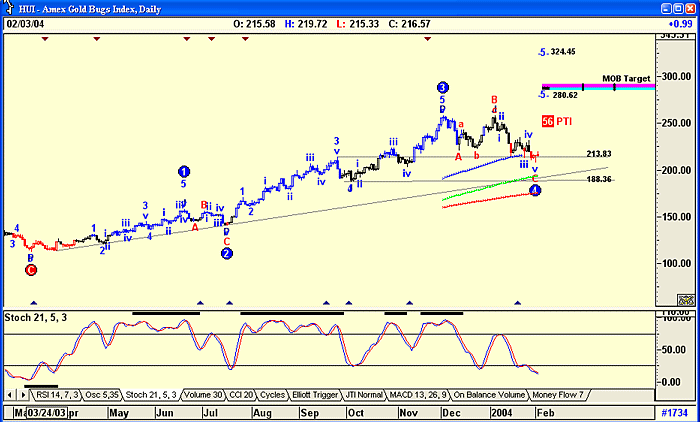
| The Amex Gold BUGS (basket of unhedged gold stocks) Index (HUI) is a modified equal dollar weighted index of companies involved in gold mining. The HUI Index was designed to provide significant exposure to near-term movements in gold prices by including companies that do not hedge their gold production beyond one and a half years. The HUI Index as developed, had a base value of 200.00 as of March 15, 1996. Adjustments are made quarterly after the close of trading on the third Friday of March, June, September and December so that each component stock represents its assigned weight in the index. The chart shows a classic Elliott wave structure, and is in the process of completing a major Wave 4, which should bottom somewhere between 188.36 and 213.83, the 4th wave of lesser degree. The chart is suggesting that 213.83 could be a strong support level, and seems to have done just by bouncing along the support level. |
| The stochastic indicator is oversold, but has not given a buy signal, suggesting that there could be a little more downside before the Wave 5 up-move that will target either the 280.62 level or the 324.45 level, both being suggested Fibonacci targets. The MOB (make or break) target favors the former level. |

|
| Is the HUI anticipating a rising Gold price? |
| Graphic provided by: AdvancedGET. |
| |
| The MOB study is a tool found with the Advanced GET program. It can help you find the target price area for the end of an Elliott wave 5, or for any pattern that has an impulse-correction-impulse type of pattern. It is drawn from the top (market moving up) or bottom (market moving down) of the starting impulse pattern that is closest to the current market movement. The Wave 5 projection is the area that the MOB will show a support area that will either "make" the end of Wave 5 or will "break" the Wave 5 into an extension. |
| Does this chart suggest that gold could once again start moving up? It sure looks like it, and with a suggested 31% rise, weakness at present levels could be a good opportunity to buy a favored gold share. |
Has been a technical analyst since 1969, and has worked as a futures and options trader with First Financial Futures in Johannesburg, South Africa.
| Address: | 3256 West 24th Ave |
| Vancouver, BC | |
| Phone # for sales: | 6042634214 |
| E-mail address: | petroosp@gmail.com |
Click here for more information about our publications!
Comments
Date: 02/12/04Rank: 4Comment:

|

Request Information From Our Sponsors
- StockCharts.com, Inc.
- Candle Patterns
- Candlestick Charting Explained
- Intermarket Technical Analysis
- John Murphy on Chart Analysis
- John Murphy's Chart Pattern Recognition
- John Murphy's Market Message
- MurphyExplainsMarketAnalysis-Intermarket Analysis
- MurphyExplainsMarketAnalysis-Visual Analysis
- StockCharts.com
- Technical Analysis of the Financial Markets
- The Visual Investor
- VectorVest, Inc.
- Executive Premier Workshop
- One-Day Options Course
- OptionsPro
- Retirement Income Workshop
- Sure-Fire Trading Systems (VectorVest, Inc.)
- Trading as a Business Workshop
- VectorVest 7 EOD
- VectorVest 7 RealTime/IntraDay
- VectorVest AutoTester
- VectorVest Educational Services
- VectorVest OnLine
- VectorVest Options Analyzer
- VectorVest ProGraphics v6.0
- VectorVest ProTrader 7
- VectorVest RealTime Derby Tool
- VectorVest Simulator
- VectorVest Variator
- VectorVest Watchdog
