

HOT TOPICS LIST
- MACD
- Fibonacci
- RSI
- Gann
- ADXR
- Stochastics
- Volume
- Triangles
- Futures
- Cycles
- Volatility
- ZIGZAG
- MESA
- Retracement
- Aroon
INDICATORS LIST
LIST OF TOPICS
PRINT THIS ARTICLE
by Kevin Hopson
As expected, ExxonMobil Corp. has proceeded higher after last December's channel breakout. Oddly enough, the stock has formed another bullish trading range, indicating more upside potential in the near-term.
Position: Accumulate
Kevin Hopson
Kevin has been a technical analyst for roughly 10 years now. Previously, Kevin owned his own business and acted as a registered investment advisor, specializing in energy. He was also a freelance oil analyst for Orient Trading Co., a commodity futures trading firm in Japan. Kevin is currently a freelance writer.
PRINT THIS ARTICLE
CHANNEL LINES
Another Bullish Holding Pattern For ExxonMobil?
02/03/04 09:16:11 AMby Kevin Hopson
As expected, ExxonMobil Corp. has proceeded higher after last December's channel breakout. Oddly enough, the stock has formed another bullish trading range, indicating more upside potential in the near-term.
Position: Accumulate
| I touched on ExxonMobil Corp. (XOM) a few weeks ago when the stock broke out of a six-month trading range between the $35.00 and $38.50 levels. At that time, I recommended accumulating shares of ExxonMobil, as the trading range breakout indicated a potential upside target of $45.00 to $49.00. This price target was calculated by taking the number of times that ExxonMobil tested the top channel line (3), multiplying this number by the width of the trading range ($38.50 - $35.00 = $3.50) and then adding this figure ($3.50 x 3 = $10.50) to the bottom ($35.00 + $10.50 = $45.50) and top ($38.50 + $10.50 = $49.00) channel lines. |
| Since December's breakout, ExxonMobil has proceeded higher, recently hitting a new 52-week high in the process. However, as you can see in the one-year chart, the stock is once again stuck in a trading range. ExxonMobil has been finding support at the $40.00 level while continuing to meet resistance (double top) around the $41.60 level. Since trading ranges tend to be continuation patterns and the trend is positive, I believe ExxonMobil will see another upside breakout in the near-term. |
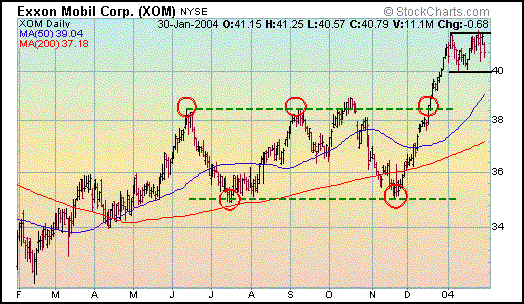
|
| Graphic provided by: Stockcharts.com. |
| |
| Currently, an upside breakout would indicate a potential price target of $43.20 to $44.80. I calculated this price target by taking the number of times ExxonMobil has tested the top channel line thus far (2), multiplying this number by the width of the trading range ($41.60 - $40.00 = $1.60) and then adding this figure ($1.60 x 2 = $3.20) to the bottom ($40.00 + $3.20 = $43.20) and top ($41.60 + $3.20 = $44.80) channel lines. |
| This calculation assumes that ExxonMobil will break to the upside without testing the bottom channel line again. Obviously, if ExxonMobil tests the bottom channel line again before breaking to the upside, the price target calculation will be higher. At minimum, ExxonMobil should make its way up to the $43.00 to $45.00 range in the near-term, with a longer-term price target of $49.00 certainly possible. As a result, I would continue to accumulate shares on weakness. |
Kevin has been a technical analyst for roughly 10 years now. Previously, Kevin owned his own business and acted as a registered investment advisor, specializing in energy. He was also a freelance oil analyst for Orient Trading Co., a commodity futures trading firm in Japan. Kevin is currently a freelance writer.
| Glen Allen, VA | |
| E-mail address: | hopson_1@yahoo.com |
Click here for more information about our publications!
PRINT THIS ARTICLE

Request Information From Our Sponsors
- StockCharts.com, Inc.
- Candle Patterns
- Candlestick Charting Explained
- Intermarket Technical Analysis
- John Murphy on Chart Analysis
- John Murphy's Chart Pattern Recognition
- John Murphy's Market Message
- MurphyExplainsMarketAnalysis-Intermarket Analysis
- MurphyExplainsMarketAnalysis-Visual Analysis
- StockCharts.com
- Technical Analysis of the Financial Markets
- The Visual Investor
- VectorVest, Inc.
- Executive Premier Workshop
- One-Day Options Course
- OptionsPro
- Retirement Income Workshop
- Sure-Fire Trading Systems (VectorVest, Inc.)
- Trading as a Business Workshop
- VectorVest 7 EOD
- VectorVest 7 RealTime/IntraDay
- VectorVest AutoTester
- VectorVest Educational Services
- VectorVest OnLine
- VectorVest Options Analyzer
- VectorVest ProGraphics v6.0
- VectorVest ProTrader 7
- VectorVest RealTime Derby Tool
- VectorVest Simulator
- VectorVest Variator
- VectorVest Watchdog