HOT TOPICS LIST
- MACD
- Fibonacci
- RSI
- Gann
- ADXR
- Stochastics
- Volume
- Triangles
- Futures
- Cycles
- Volatility
- ZIGZAG
- MESA
- Retracement
- Aroon
INDICATORS LIST
LIST OF TOPICS
PRINT THIS ARTICLE
by Gary Grosschadl
ASCA breaks into an 18-month high.
Position: Buy
Gary Grosschadl
Independent Canadian equities trader and technical analyst based in Peterborough
Ontario, Canada.
PRINT THIS ARTICLE
ASCENDING TRIANGLES
Ameristar Casinos Inc. Breaks Out
02/03/04 01:03:20 PMby Gary Grosschadl
ASCA breaks into an 18-month high.
Position: Buy
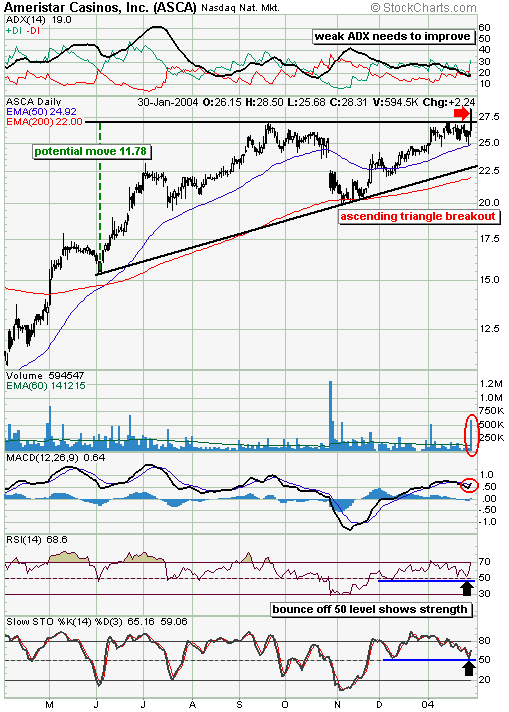
| Typically ascending triangles are bullish patterns that indicate accumulation and are considered continuation patterns occurring in uptrends. This daily chart shows a breakout attempt on a volume surge - bigger volume is required on any breakout/breakdown to show conviction on the part of traders. |
| The target for this pattern breakout is measured at the widest point of the triangle as shown, giving a very bullish target of an $11.78 gain to the $38 region. This may take some time to develop and no doubt there will be consolidations and retracements along the way. The previous high water mark going back to April 2002 was $34 and this level will most likely offer resistance as profit takers may focus on this as a potential trading target. |

|
| ASCA's daily chart showing a pattern breakout. |
| Graphic provided by: Stockcharts.com. |
| |
| Several indicators are considered. The directional movement indicator (DMI) at the top of the chart shows a rather weak ADX of 19 and it needs to change direction. A move above 25 would give confirmation of a strengthening bullish trend. The lower indicators show a more bullish picture. The MACD (moving average convergence/divergence) shows a bullish crossover. Crossovers above the zero line are often especially bullish. The RSI (relative strength indicator) and the stochastics indicator both show a bounce off the 50 level which is often a great indication of latent strength. |
| Breakouts of patterns can result in a later test of the breakout point before the uptrend resumes and this is something to consider as this move evolves. This does not mean it will happen, only that it can. |
Independent Canadian equities trader and technical analyst based in Peterborough
Ontario, Canada.
| Website: | www.whatsonsale.ca/financial.html |
| E-mail address: | gwg7@sympatico.ca |
Click here for more information about our publications!
Comments
Date: 02/10/04Rank: 5Comment:

|

Request Information From Our Sponsors
- VectorVest, Inc.
- Executive Premier Workshop
- One-Day Options Course
- OptionsPro
- Retirement Income Workshop
- Sure-Fire Trading Systems (VectorVest, Inc.)
- Trading as a Business Workshop
- VectorVest 7 EOD
- VectorVest 7 RealTime/IntraDay
- VectorVest AutoTester
- VectorVest Educational Services
- VectorVest OnLine
- VectorVest Options Analyzer
- VectorVest ProGraphics v6.0
- VectorVest ProTrader 7
- VectorVest RealTime Derby Tool
- VectorVest Simulator
- VectorVest Variator
- VectorVest Watchdog
- StockCharts.com, Inc.
- Candle Patterns
- Candlestick Charting Explained
- Intermarket Technical Analysis
- John Murphy on Chart Analysis
- John Murphy's Chart Pattern Recognition
- John Murphy's Market Message
- MurphyExplainsMarketAnalysis-Intermarket Analysis
- MurphyExplainsMarketAnalysis-Visual Analysis
- StockCharts.com
- Technical Analysis of the Financial Markets
- The Visual Investor
