HOT TOPICS LIST
- MACD
- Fibonacci
- RSI
- Gann
- ADXR
- Stochastics
- Volume
- Triangles
- Futures
- Cycles
- Volatility
- ZIGZAG
- MESA
- Retracement
- Aroon
INDICATORS LIST
LIST OF TOPICS
PRINT THIS ARTICLE
by Ashwani Gujral
The Networking sector is undergoing a correction after a huge rally to the upside. This correction is happening on a bullish falling wedge pattern.
Position: Buy
Ashwani Gujral
He is founder of AGIP Securities Pvt. Ltd. which offers money management services, live chat rooms (during market hours) and independent technical analysis consultancy. The company has a big media presence from the likes of CNBC, NDTV Profit, and ZEE Business.
PRINT THIS ARTICLE
WEDGE FORMATIONS
Opportunity In The Networking Sector
02/06/04 11:59:35 AMby Ashwani Gujral
The Networking sector is undergoing a correction after a huge rally to the upside. This correction is happening on a bullish falling wedge pattern.
Position: Buy
| Continuation patterns are small pauses in ongoing trends, when the market or the stock pauses for breath before continuing. These patterns offer a low risk entry into continuing trends and a close stop-loss. Buying into this pause as the market gathers momentum for a fresh upmove, reduces the likelihood of a trader catching a top or a bottom. |
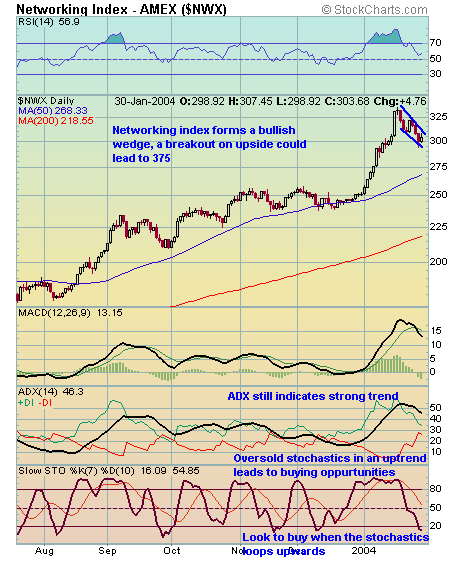
| The beauty of these patterns are that the market has everything in place -- the direction and the target -- so nyou only have to shoot. The target for continuation patterns often is a similar sized move to the one that occurred before the pattern. Again, volume plays an important role in continuation patterns. Volume rises in the direction of the trend and declines during the continuation pattern. The consolidation should take place on considerably lighter volume. Volume should pick up again as the price breaks out for a fresh move. Traders are well advised to wait for a high volume breakout instead of preempting these breakouts. Let's have a look at the daily chart of the Networking index. |

|
| Figure 1: Daily chart of the Networking index. |
| Graphic provided by: Stockcharts.com. |
| |
| A bullish wedge has formed as a countertrend to an upmove. The wedge's lines, forming the boundaries of the consolidation, keep narrowing on declining volume. The price finally breaks out to the upside, continuing the upmove. Bullish wedges can occur both as continuation patterns and reversal patterns. The Networking index is likely to be the first to bounce when the Nasdaq resumes its rally. The target for the subsequent upmove could be 375. The buy signal will come from the actual price breakout and the stochastics crossing upwards. |
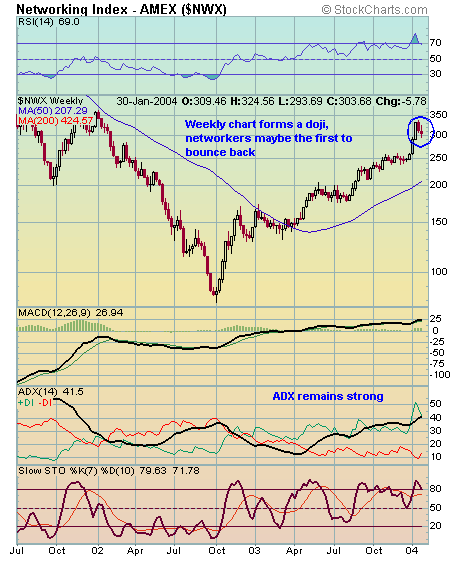
 Figure 2: Weekly chart of the $NWX. On the weekly chart, the Networking index is forming a doji which can often indicate the end of the correction, especially in light of the falling wedge on the daily chart. The ADX continues to look strong and the trend is in place. Thus there should be no harm in taking an entry using an oversold condition in the daily chart. This breakout can be used to take entries into the leading stocks in the Networking index. It is likely that they have similar chart patterns. |
He is founder of AGIP Securities Pvt. Ltd. which offers money management services, live chat rooms (during market hours) and independent technical analysis consultancy. The company has a big media presence from the likes of CNBC, NDTV Profit, and ZEE Business.
| Title: | Chief mkt strategist |
| Company: | AGIP Securities |
| India | |
| Phone # for sales: | 9871066337 |
| Website: | www.ashwanigujral.com |
| E-mail address: | contact@ashwanigujral.com |
Traders' Resource Links | |
| AGIP Securities has not added any product or service information to TRADERS' RESOURCE. | |
Click here for more information about our publications!
Comments
Date: 02/10/04Rank: 5Comment: Thank you for your input. I find your t/a style one of my favorites at traders.com. Keep up the great work.
Date: 02/26/04Rank: 5Comment:

|

Request Information From Our Sponsors
- StockCharts.com, Inc.
- Candle Patterns
- Candlestick Charting Explained
- Intermarket Technical Analysis
- John Murphy on Chart Analysis
- John Murphy's Chart Pattern Recognition
- John Murphy's Market Message
- MurphyExplainsMarketAnalysis-Intermarket Analysis
- MurphyExplainsMarketAnalysis-Visual Analysis
- StockCharts.com
- Technical Analysis of the Financial Markets
- The Visual Investor
- VectorVest, Inc.
- Executive Premier Workshop
- One-Day Options Course
- OptionsPro
- Retirement Income Workshop
- Sure-Fire Trading Systems (VectorVest, Inc.)
- Trading as a Business Workshop
- VectorVest 7 EOD
- VectorVest 7 RealTime/IntraDay
- VectorVest AutoTester
- VectorVest Educational Services
- VectorVest OnLine
- VectorVest Options Analyzer
- VectorVest ProGraphics v6.0
- VectorVest ProTrader 7
- VectorVest RealTime Derby Tool
- VectorVest Simulator
- VectorVest Variator
- VectorVest Watchdog
