HOT TOPICS LIST
- MACD
- Fibonacci
- RSI
- Gann
- ADXR
- Stochastics
- Volume
- Triangles
- Futures
- Cycles
- Volatility
- ZIGZAG
- MESA
- Retracement
- Aroon
INDICATORS LIST
LIST OF TOPICS
PRINT THIS ARTICLE
by Ashwani Gujral
Stocks breaking out of consolidation or continuation patterns are always the surest trades. In this example, CNET breaks out of a flag pattern on very heavy volume to hit new 52-week highs.
Position: Buy
Ashwani Gujral
He is founder of AGIP Securities Pvt. Ltd. which offers money management services, live chat rooms (during market hours) and independent technical analysis consultancy. The company has a big media presence from the likes of CNBC, NDTV Profit, and ZEE Business.
PRINT THIS ARTICLE
FLAGS AND PENNANTS
CNET Breaks Out To New 52-Week Highs
02/09/04 09:22:59 AMby Ashwani Gujral
Stocks breaking out of consolidation or continuation patterns are always the surest trades. In this example, CNET breaks out of a flag pattern on very heavy volume to hit new 52-week highs.
Position: Buy
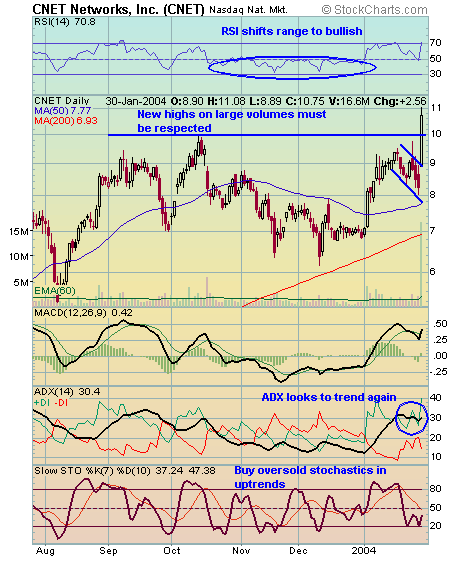
| When a trader uses technical analysis to make a profit, the color of the money remains the same no matter what indicator or pattern is used. Bull and bear flag patterns frequently occur in strong ongoing trends in an index or individual stock. These are pauses in a trend that help traders enter in a low risk manner. A flag generally occurs in the middle of a move and thus leads to a move similar in size to the one preceding it. Traders should watch for these continuation patterns and look to trade them rather than the more complex consolidation moves, as often as possible. Now, look at CNET's daily chart below. |

|
| Figure 1: Daily chart of CNET. |
| Graphic provided by: Stockcharts.com. |
| |
| On CNET's daily chart the price forms a flag pattern in the ongoing upmove and then breaks out on very heavy volume, making new 52-week highs and crossing a significant upward pivot in the process. New 52-week highs should be respected and a heavy volume breakout is evidence of a large demand for that stock. At the same time, the ADX had declined to around 30, indicating consolidation, and is now starting to move up again. The stochastics (7,10) indicator is oversold and the fast line is about to cross over the slow line, which would give another buy signal. The evidence so far is sufficient to establish a long position on the stock. The stop-loss can be kept at the lower end of the flag, around $8. |
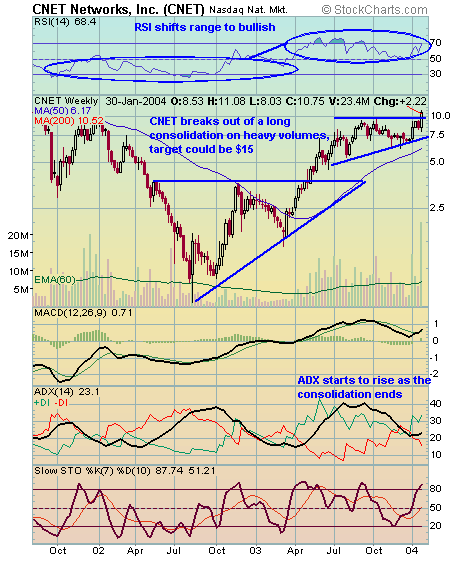
 Figure 2: Weekly chart of CNET. On the weekly chart, CNET had bottomed out earlier, forming a large ascending triangle, then rallied and was consolidating for a long time before this breakout. The ADX, which was declining throughout the consolidation, has now started rising over 20, indicating a trend. As consolidation generally occurs in the middle of moves, it would be safe to assume a target of $15 in the medium-term. |
He is founder of AGIP Securities Pvt. Ltd. which offers money management services, live chat rooms (during market hours) and independent technical analysis consultancy. The company has a big media presence from the likes of CNBC, NDTV Profit, and ZEE Business.
| Title: | Chief mkt strategist |
| Company: | AGIP Securities |
| India | |
| Phone # for sales: | 9871066337 |
| Website: | www.ashwanigujral.com |
| E-mail address: | contact@ashwanigujral.com |
Traders' Resource Links | |
| AGIP Securities has not added any product or service information to TRADERS' RESOURCE. | |
Click here for more information about our publications!
Comments
Date: 02/10/04Rank: 5Comment:

|

Request Information From Our Sponsors
- VectorVest, Inc.
- Executive Premier Workshop
- One-Day Options Course
- OptionsPro
- Retirement Income Workshop
- Sure-Fire Trading Systems (VectorVest, Inc.)
- Trading as a Business Workshop
- VectorVest 7 EOD
- VectorVest 7 RealTime/IntraDay
- VectorVest AutoTester
- VectorVest Educational Services
- VectorVest OnLine
- VectorVest Options Analyzer
- VectorVest ProGraphics v6.0
- VectorVest ProTrader 7
- VectorVest RealTime Derby Tool
- VectorVest Simulator
- VectorVest Variator
- VectorVest Watchdog
- StockCharts.com, Inc.
- Candle Patterns
- Candlestick Charting Explained
- Intermarket Technical Analysis
- John Murphy on Chart Analysis
- John Murphy's Chart Pattern Recognition
- John Murphy's Market Message
- MurphyExplainsMarketAnalysis-Intermarket Analysis
- MurphyExplainsMarketAnalysis-Visual Analysis
- StockCharts.com
- Technical Analysis of the Financial Markets
- The Visual Investor
