

HOT TOPICS LIST
- MACD
- Fibonacci
- RSI
- Gann
- ADXR
- Stochastics
- Volume
- Triangles
- Futures
- Cycles
- Volatility
- ZIGZAG
- MESA
- Retracement
- Aroon
INDICATORS LIST
LIST OF TOPICS
PRINT THIS ARTICLE
by Ashwani Gujral
The U.S. interest rate scenario has a profound effect on the U.S. dollar as well as gold. As the Fed changed a couple of words in its policy statement, the effect on the charts is clearly visible. While the U.S. dollar has started to firm up, gold has broken down from a daily bearish formation.
Position: N/A
Ashwani Gujral
He is founder of AGIP Securities Pvt. Ltd. which offers money management services, live chat rooms (during market hours) and independent technical analysis consultancy. The company has a big media presence from the likes of CNBC, NDTV Profit, and ZEE Business.
PRINT THIS ARTICLE
HEAD & SHOULDERS
The Dollar Firms Up And Gold Melts
02/03/04 09:31:57 AMby Ashwani Gujral
The U.S. interest rate scenario has a profound effect on the U.S. dollar as well as gold. As the Fed changed a couple of words in its policy statement, the effect on the charts is clearly visible. While the U.S. dollar has started to firm up, gold has broken down from a daily bearish formation.
Position: N/A
| Charts often start discounting news well before the event. On the daily chart, the U.S. dollar had started forming a short-term bottom and gold had started forming a bearish head and shoulder pattern before the Fed changed it policy statement. Whether changing a couple of words means anything for the direction of interest rates, the charts show that at least some smart investors/traders have started taking profits on both. Whether this short-term bottom and top for the U.S. dollar and gold respectively turns into long-term bottoming and topping out is still to be seen. |
| The fundamental theory is that, if the Fed is hinting at increasing rates, then investors all over the world who had taken their money out of dollar denominated assets into gold, would now be pulling out of gold and putting the money back into U.S. dollar assets. Let's examine the daily chart for both. |
|
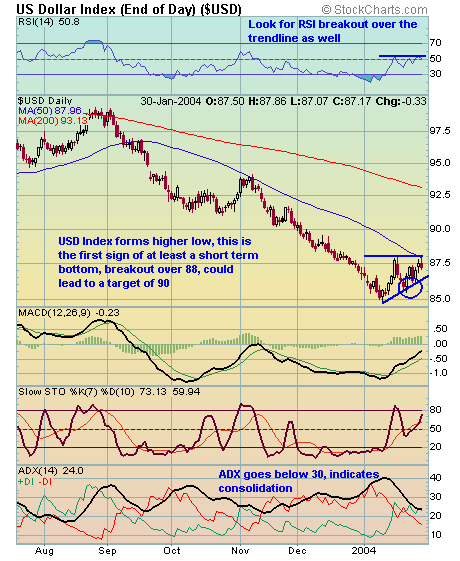
| Figure 1: Daily chart of the U.S. dollar. |
| Graphic provided by: Stockcharts.com. |
| |
| The above daily U.S. dollar index chart shows a higher bottom and the formation of an ascending triangle. This ascending triangle gives a target of 90. A breakout from the 88 level will lead to at least a sideways move in the daily chart. So for now the relentless plunge of the dollar has been arrested. As the ADX has declined below 30, it shows consolidation and the end of the strong downtrend, at least temporarily. A breakout of the trendline shown on the RSI will show a shift from bearish to bullish bias. The short-term bottom does not necessarily mean that the dollar will rally sharply from here but is likely to form some kind of trading range. |
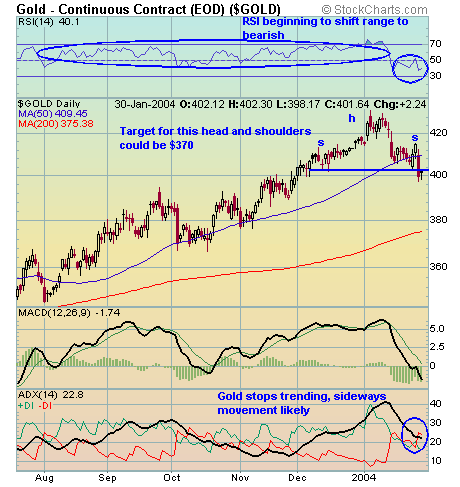 Figure 2: Daily chart of the continuous gold contract. Gold, on the other hand, shows the exact opposite of the dollar, with profit booking in gold being far more aggressive, as it has broken down from a daily bearish head and shoulders pattern. The target of this pattern could be $370-380 where gold should find strong support. Again this could be the beginning of a distributive pattern or a sideways formation and not a complete reversal. The ADX has declined below 30, which shows consolidation. The RSI is also in the process of shifting its range from bullish to bearish. |
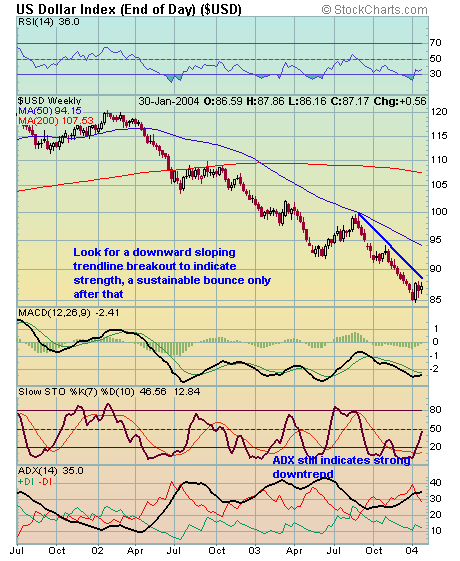 Figure 2: Weekly chart of the U.S. dollar. Now look at the weekly chart to see the long-term trends. Little has changed for the USD index. The first test of strength will be the upward breakout of the downward sloping trendline. The ADX still is rising to 35 which shows the long-term downtrend persists. Charts take a long time to reverse their long-term trends and events in the coming months will determine if the USD needs to bottom out. My best bet would be the establishment of a trading range while accumulation takes place. 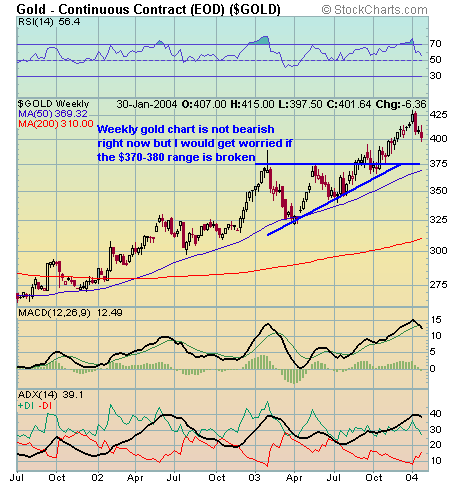 Figure 4: Weekly chart of the continuous gold contract. Similarly on the Gold weekly chart, there are no signs of bearishness. Currently the decline in gold prices simply seems like a normal reaction to the ascending triangle breakout. Again, I don't expect the $370-380 range to be broken anytime soon and the most likely scenario is a sideways movement as the Fed takes a stand and interest rates firm up. The ADX is still around 40 and indicates strength in the trend. |
He is founder of AGIP Securities Pvt. Ltd. which offers money management services, live chat rooms (during market hours) and independent technical analysis consultancy. The company has a big media presence from the likes of CNBC, NDTV Profit, and ZEE Business.
| Title: | Chief mkt strategist |
| Company: | AGIP Securities |
| India | |
| Phone # for sales: | 9871066337 |
| Website: | www.ashwanigujral.com |
| E-mail address: | contact@ashwanigujral.com |
Traders' Resource Links | |
| AGIP Securities has not added any product or service information to TRADERS' RESOURCE. | |
Click here for more information about our publications!
Comments
Date:�02/17/04Rank:�5Comment:�

Request Information From Our Sponsors
- VectorVest, Inc.
- Executive Premier Workshop
- One-Day Options Course
- OptionsPro
- Retirement Income Workshop
- Sure-Fire Trading Systems (VectorVest, Inc.)
- Trading as a Business Workshop
- VectorVest 7 EOD
- VectorVest 7 RealTime/IntraDay
- VectorVest AutoTester
- VectorVest Educational Services
- VectorVest OnLine
- VectorVest Options Analyzer
- VectorVest ProGraphics v6.0
- VectorVest ProTrader 7
- VectorVest RealTime Derby Tool
- VectorVest Simulator
- VectorVest Variator
- VectorVest Watchdog
- StockCharts.com, Inc.
- Candle Patterns
- Candlestick Charting Explained
- Intermarket Technical Analysis
- John Murphy on Chart Analysis
- John Murphy's Chart Pattern Recognition
- John Murphy's Market Message
- MurphyExplainsMarketAnalysis-Intermarket Analysis
- MurphyExplainsMarketAnalysis-Visual Analysis
- StockCharts.com
- Technical Analysis of the Financial Markets
- The Visual Investor