HOT TOPICS LIST
- MACD
- Fibonacci
- RSI
- Gann
- ADXR
- Stochastics
- Volume
- Triangles
- Futures
- Cycles
- Volatility
- ZIGZAG
- MESA
- Retracement
- Aroon
INDICATORS LIST
LIST OF TOPICS
PRINT THIS ARTICLE
by Kevin Hopson
Natural gas may have put in a significant top earlier this month but there are a number of signs pointing to higher prices in the near-term.
Position: N/A
Kevin Hopson
Kevin has been a technical analyst for roughly 10 years now. Previously, Kevin owned his own business and acted as a registered investment advisor, specializing in energy. He was also a freelance oil analyst for Orient Trading Co., a commodity futures trading firm in Japan. Kevin is currently a freelance writer.
PRINT THIS ARTICLE
TECHNICAL ANALYSIS
Are Natural Gas Prices Ready To Move Higher Again?
02/02/04 09:49:24 AMby Kevin Hopson
Natural gas may have put in a significant top earlier this month but there are a number of signs pointing to higher prices in the near-term.
Position: N/A
| When I touched on natural gas prices a couple of weeks ago, I mentioned that prices may have put in a significant top after reversing earlier this month. However, I also said that my estimated wave count - which indicated a potential trend reversal - was flawed. As a result, I have remained cautious on natural gas prices in the near-term but have kept an open mind in the process. Regardless of whether or not my prior analysis proves to be correct, there are currently signs of a forthcoming bottom reversal in natural gas prices. |
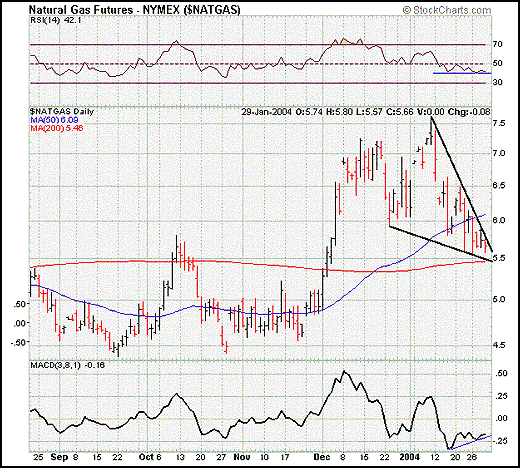
| Looking at the chart for the continuous natural gas futures contract, you will notice that prices have formed a large falling wedge. Falling wedge formations are usually bullish, as prices tend to break to the upside from this pattern more times than not. Additionally, notice that the 200-day moving average ($5.46) is coming into play around the potential completion point of the triangle. If you remember back to my prior article, I said that a breach of support around the $5.80 level could lead to an eventual test of the 200-day moving average. |

|
| Graphic provided by: Stockcharts.com. |
| |
| If this occurs, the contract could use the 200-day moving average as a potential bouncing point to break out of the falling wedge formation. Also, there have been short-term bullish divergences on the daily chart, which help support the theory that prices are ready to rebound. More specifically, the relative strength index (RSI) has been moving sideways and the moving average convergence/divergence (MACD) has been moving higher despite lower prices. These types of divergences often occur before a reversal in price. As a result, I would look for higher natural gas prices in the near-term. |
Kevin has been a technical analyst for roughly 10 years now. Previously, Kevin owned his own business and acted as a registered investment advisor, specializing in energy. He was also a freelance oil analyst for Orient Trading Co., a commodity futures trading firm in Japan. Kevin is currently a freelance writer.
| Glen Allen, VA | |
| E-mail address: | hopson_1@yahoo.com |
Click here for more information about our publications!
PRINT THIS ARTICLE

|

Request Information From Our Sponsors
- StockCharts.com, Inc.
- Candle Patterns
- Candlestick Charting Explained
- Intermarket Technical Analysis
- John Murphy on Chart Analysis
- John Murphy's Chart Pattern Recognition
- John Murphy's Market Message
- MurphyExplainsMarketAnalysis-Intermarket Analysis
- MurphyExplainsMarketAnalysis-Visual Analysis
- StockCharts.com
- Technical Analysis of the Financial Markets
- The Visual Investor
- VectorVest, Inc.
- Executive Premier Workshop
- One-Day Options Course
- OptionsPro
- Retirement Income Workshop
- Sure-Fire Trading Systems (VectorVest, Inc.)
- Trading as a Business Workshop
- VectorVest 7 EOD
- VectorVest 7 RealTime/IntraDay
- VectorVest AutoTester
- VectorVest Educational Services
- VectorVest OnLine
- VectorVest Options Analyzer
- VectorVest ProGraphics v6.0
- VectorVest ProTrader 7
- VectorVest RealTime Derby Tool
- VectorVest Simulator
- VectorVest Variator
- VectorVest Watchdog
