HOT TOPICS LIST
- MACD
- Fibonacci
- RSI
- Gann
- ADXR
- Stochastics
- Volume
- Triangles
- Futures
- Cycles
- Volatility
- ZIGZAG
- MESA
- Retracement
- Aroon
INDICATORS LIST
LIST OF TOPICS
PRINT THIS ARTICLE
by Arthur Hill
The iShares 20-Year Treasury Fund (TLT) has turned violent over the last few months as bulls and bears slug it out for control. The medium-term trend is up, but the this appears to be a corrective move within a larger downtrend.
Position: Hold
Arthur Hill
Arthur Hill is currently editor of TDTrader.com, a website specializing in trading strategies, sector/industry specific breadth stats and overall technical analysis. He passed the Society of Technical Analysts (STA London) diploma exam with distinction is a Certified Financial Technician (CFTe). Prior to TD Trader, he was the Chief Technical Analyst for Stockcharts.com and the main contributor to the ChartSchool.
PRINT THIS ARTICLE
Reckless Bonds
01/30/04 01:35:35 PMby Arthur Hill
The iShares 20-Year Treasury Fund (TLT) has turned violent over the last few months as bulls and bears slug it out for control. The medium-term trend is up, but the this appears to be a corrective move within a larger downtrend.
Position: Hold
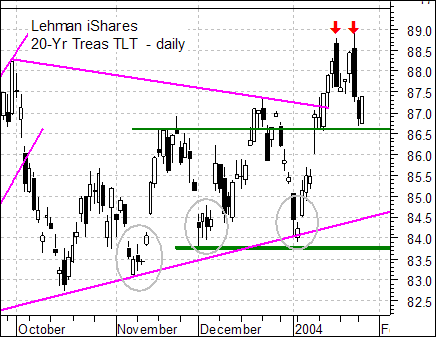
 Figure 1: Daily chart of TLT. Recent violence is clear on the daily chart. TLT formed gap laden reversals in November, early December and early January (gray ovals). Each reversal resulted in a higher high that was shortly followed by a sharp pullback. The most recent high formed with two large bearish engulfing patterns (red arrows). Despite these two candlestick reversal patterns, the string of higher highs and higher lows (uptrend) remains intact with broken resistance around 86.5 turning into support. |

|
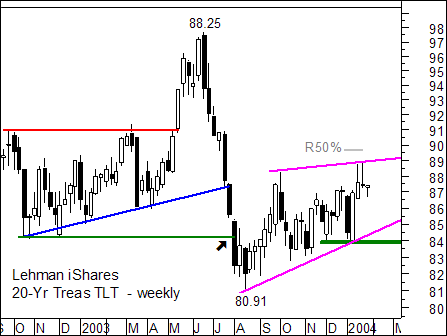
| Figure 2: Weekly chart of TLT. |
| Graphic provided by: MetaStock. |
| |
| Looking at the weekly chart, the current advance is brought into perspective. TLT declined from 88.25 to 80.91 in just two months. This blood-curdling decline broke the prior lows (black arrow) and ushered in a long-term trend change (now down). |
| After such a sharp decline, a consolidation or retracement can be expected. Consolidation patterns might take the shape of a rising wedge or price channel and a typical retracement would range from 38% to 62%. The current advance has retraced just under 50% of the prior decline and looks like a rising wedge. The bull controls the medium-term trend as long as this lower trendline holds. A move below the lower trendline (85) would be quite negative and further weakness below major support at 84 would signal a continuation lower. |
Arthur Hill is currently editor of TDTrader.com, a website specializing in trading strategies, sector/industry specific breadth stats and overall technical analysis. He passed the Society of Technical Analysts (STA London) diploma exam with distinction is a Certified Financial Technician (CFTe). Prior to TD Trader, he was the Chief Technical Analyst for Stockcharts.com and the main contributor to the ChartSchool.
| Title: | Editor |
| Company: | TDTrader.com |
| Address: | Willem Geetsstraat 17 |
| Mechelen, B2800 | |
| Phone # for sales: | 3215345465 |
| Website: | www.tdtrader.com |
| E-mail address: | arthurh@tdtrader.com |
Traders' Resource Links | |
| TDTrader.com has not added any product or service information to TRADERS' RESOURCE. | |
Click here for more information about our publications!
Comments
Date: 02/05/04Rank: 4Comment:

Request Information From Our Sponsors
- VectorVest, Inc.
- Executive Premier Workshop
- One-Day Options Course
- OptionsPro
- Retirement Income Workshop
- Sure-Fire Trading Systems (VectorVest, Inc.)
- Trading as a Business Workshop
- VectorVest 7 EOD
- VectorVest 7 RealTime/IntraDay
- VectorVest AutoTester
- VectorVest Educational Services
- VectorVest OnLine
- VectorVest Options Analyzer
- VectorVest ProGraphics v6.0
- VectorVest ProTrader 7
- VectorVest RealTime Derby Tool
- VectorVest Simulator
- VectorVest Variator
- VectorVest Watchdog
- StockCharts.com, Inc.
- Candle Patterns
- Candlestick Charting Explained
- Intermarket Technical Analysis
- John Murphy on Chart Analysis
- John Murphy's Chart Pattern Recognition
- John Murphy's Market Message
- MurphyExplainsMarketAnalysis-Intermarket Analysis
- MurphyExplainsMarketAnalysis-Visual Analysis
- StockCharts.com
- Technical Analysis of the Financial Markets
- The Visual Investor
