HOT TOPICS LIST
- MACD
- Fibonacci
- RSI
- Gann
- ADXR
- Stochastics
- Volume
- Triangles
- Futures
- Cycles
- Volatility
- ZIGZAG
- MESA
- Retracement
- Aroon
INDICATORS LIST
LIST OF TOPICS
PRINT THIS ARTICLE
by Koos van der Merwe
On June 18, 2003 I presented a daily chart of the London PM Gold cycle with observations. Has gold stuck to that cycle?
Position: Hold
Koos van der Merwe
Has been a technical analyst since 1969, and has worked as a futures and options trader with First Financial Futures in Johannesburg, South Africa.
PRINT THIS ARTICLE
CYCLES
Gold Cycle Revisited
01/29/04 08:09:02 AMby Koos van der Merwe
On June 18, 2003 I presented a daily chart of the London PM Gold cycle with observations. Has gold stuck to that cycle?
Position: Hold
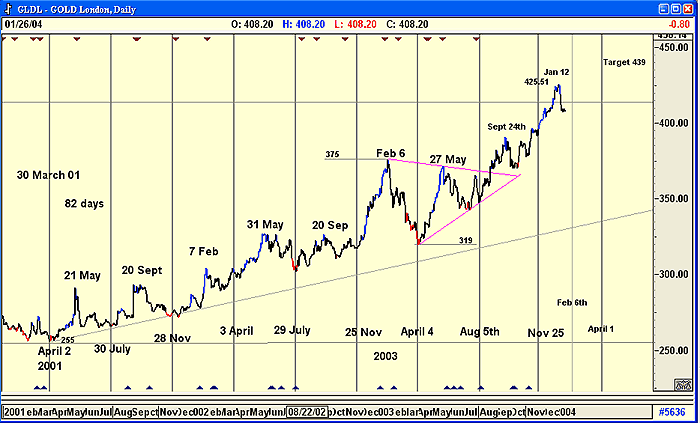
| The chart is pretty much self-explanatory. The expected cycle low of August 5th was met but with a minor low, part of a consolidation triangle formation. The expected high of September 24th was also met, but the low expected for November 25th was a higher insignificant low. The high of January 12th is far too early, suggesting that the gold price could rise from present levels to meet the expected high of February 6th, before falling into the April 1st cycle low, (or could it be an April fool's low similar to the one in November?). The triangle, that has formed is suggesting a target of $439. (375-255 = 120 + 319 = 439). |
| Is the unusual pattern of the gold cycle still there? The answer to this question appears to be a decided yes. Holders can definitely expect an upward move to the February 6th cycle date, but I don't believe the move can exceed the $425.51 of January 12th. |

|
| The gold cycle. |
| Graphic provided by: CQG. |
| |
| Will the target of $439 will be met before or after April 1st? I believe it will be after April 1st, but possibly before the next cycle low expected at the end of July. Finally, would I buy gold shares at present levels? Yes, but selectively and non-speculative. With Central bank selling as gold moves to higher levels, holding gold shares could become risky. |
Has been a technical analyst since 1969, and has worked as a futures and options trader with First Financial Futures in Johannesburg, South Africa.
| Address: | 3256 West 24th Ave |
| Vancouver, BC | |
| Phone # for sales: | 6042634214 |
| E-mail address: | petroosp@gmail.com |
Click here for more information about our publications!
Comments

Request Information From Our Sponsors
- VectorVest, Inc.
- Executive Premier Workshop
- One-Day Options Course
- OptionsPro
- Retirement Income Workshop
- Sure-Fire Trading Systems (VectorVest, Inc.)
- Trading as a Business Workshop
- VectorVest 7 EOD
- VectorVest 7 RealTime/IntraDay
- VectorVest AutoTester
- VectorVest Educational Services
- VectorVest OnLine
- VectorVest Options Analyzer
- VectorVest ProGraphics v6.0
- VectorVest ProTrader 7
- VectorVest RealTime Derby Tool
- VectorVest Simulator
- VectorVest Variator
- VectorVest Watchdog
- StockCharts.com, Inc.
- Candle Patterns
- Candlestick Charting Explained
- Intermarket Technical Analysis
- John Murphy on Chart Analysis
- John Murphy's Chart Pattern Recognition
- John Murphy's Market Message
- MurphyExplainsMarketAnalysis-Intermarket Analysis
- MurphyExplainsMarketAnalysis-Visual Analysis
- StockCharts.com
- Technical Analysis of the Financial Markets
- The Visual Investor
