HOT TOPICS LIST
- MACD
- Fibonacci
- RSI
- Gann
- ADXR
- Stochastics
- Volume
- Triangles
- Futures
- Cycles
- Volatility
- ZIGZAG
- MESA
- Retracement
- Aroon
INDICATORS LIST
LIST OF TOPICS
PRINT THIS ARTICLE
by David Penn
The MACD histogram can be an effective tool in spotting short opportunities as well as longs.
Position: N/A
David Penn
Technical Writer for Technical Analysis of STOCKS & COMMODITIES magazine, Working-Money.com, and Traders.com Advantage.
PRINT THIS ARTICLE
MACD
MEDI and the MACD
01/29/04 08:00:41 AMby David Penn
The MACD histogram can be an effective tool in spotting short opportunities as well as longs.
Position: N/A
| Many of the recent examples that I have presented of using the MACD histogram have involved buying during pullbacks to major moving averages. As Oliver Velez Jr. of Pristine.com has observed, it is the task of the trader in a bull market to buy "every single pullback." The only question, as far as Velez is concerned, is "when." The inverse can be said about the task of the trader in a bear market; namely, to sell every rally. Again, the only question is "when." |
| The MACD histogram appears to be an excellent tool for helping determine "when." While there are a number of sound methodologies for buying pullbacks and selling rallies -- and an equal number of "new" strategies that are essentially just retreads of pullback strategies long used by traders such as Velez and others -- the MACD histogram is valuable in part because there is less guessing about when a signal to buy or sell has been triggered. The MACD histogram also helps traders avoid selling oversold stocks and buying overbought ones. While it is true that oversold stocks can become even more oversold and overbought stocks can become even more overbought, traders looking for short-to-intermediate gains often benefit more from "buying cheap and selling dear." |

|
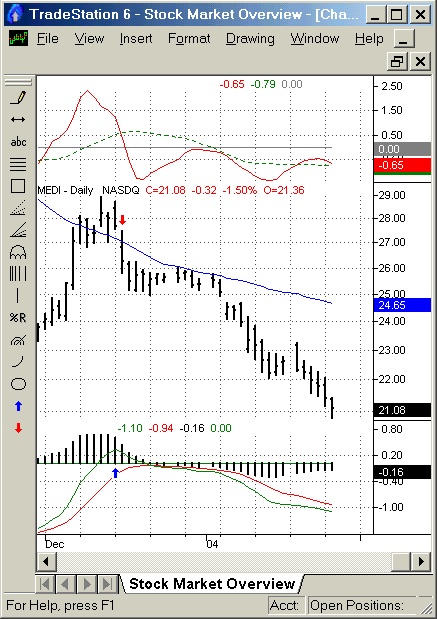
| The blue arrow near the MACD histogram marks the "shorter bar." The red arrow poits to the short entry day. |
| Graphic provided by: TradeStation. |
| |
| Consider Medimmune (MEDI). I didn't know that much of this stock's difficulties came as a result of the collapse of the "flu boom," when the nation was gripped with fear that we were running out of treatments for the flu. Soon enough, however, people realized that flu season doesn't last forever and that it is in the nature of capitalism to respond to any need the marketplace creates. Thus, whatever "edge" MEDI might have had was not likely to last. |
| As I said, I didn't know any of this at the time. But what I did know was that MEDI had fallen beneath its 50-day moving average in August and, after a brief rally in September, had entered a veritable free-fall in October. How to take advantage of this? Velez reminds us that, in a bear market, the task is to sell rallies. MEDI put in a bottom in late November near 23 and rallied strongly over the next several days, moving up above its 50-day exponential moving average and climbing as high as 28. Okay, we've got our bear market rally -- but when to short it? |
| Here is where the MACD histogram is helpful. Note how, in December, the histogram develops a series of tall bars that are nearly uniform in length. However, from December 12th to December 15th, the histogram develops a significantly shorter bar. This shorter bar is the signal that momentum is shifting and that an opportunity may exist by going short beneath the low of the shorter bar day (December 15th), or at a price of about $27.25. A sell stop at that level would have been triggered the following day. While prices moved sideways for another 12 days, the 50-day exponential moving average remained resistant to any upside price move and, by the 13th day, MEDI had finally given up any rally attempt and had begun to move down in earnest. A month later, MEDI was trading at $22.60, a $4.65 move from the sell stop mentioned above. |
Technical Writer for Technical Analysis of STOCKS & COMMODITIES magazine, Working-Money.com, and Traders.com Advantage.
| Title: | Technical Writer |
| Company: | Technical Analysis, Inc. |
| Address: | 4757 California Avenue SW |
| Seattle, WA 98116 | |
| Phone # for sales: | 206 938 0570 |
| Fax: | 206 938 1307 |
| Website: | www.Traders.com |
| E-mail address: | DPenn@traders.com |
Traders' Resource Links | |
| Charting the Stock Market: The Wyckoff Method -- Books | |
| Working-Money.com -- Online Trading Services | |
| Traders.com Advantage -- Online Trading Services | |
| Technical Analysis of Stocks & Commodities -- Publications and Newsletters | |
| Working Money, at Working-Money.com -- Publications and Newsletters | |
| Traders.com Advantage -- Publications and Newsletters | |
| Professional Traders Starter Kit -- Software | |
Click here for more information about our publications!
Comments

Request Information From Our Sponsors
- StockCharts.com, Inc.
- Candle Patterns
- Candlestick Charting Explained
- Intermarket Technical Analysis
- John Murphy on Chart Analysis
- John Murphy's Chart Pattern Recognition
- John Murphy's Market Message
- MurphyExplainsMarketAnalysis-Intermarket Analysis
- MurphyExplainsMarketAnalysis-Visual Analysis
- StockCharts.com
- Technical Analysis of the Financial Markets
- The Visual Investor
- VectorVest, Inc.
- Executive Premier Workshop
- One-Day Options Course
- OptionsPro
- Retirement Income Workshop
- Sure-Fire Trading Systems (VectorVest, Inc.)
- Trading as a Business Workshop
- VectorVest 7 EOD
- VectorVest 7 RealTime/IntraDay
- VectorVest AutoTester
- VectorVest Educational Services
- VectorVest OnLine
- VectorVest Options Analyzer
- VectorVest ProGraphics v6.0
- VectorVest ProTrader 7
- VectorVest RealTime Derby Tool
- VectorVest Simulator
- VectorVest Variator
- VectorVest Watchdog
