HOT TOPICS LIST
- MACD
- Fibonacci
- RSI
- Gann
- ADXR
- Stochastics
- Volume
- Triangles
- Futures
- Cycles
- Volatility
- ZIGZAG
- MESA
- Retracement
- Aroon
INDICATORS LIST
LIST OF TOPICS
PRINT THIS ARTICLE
by Koos van der Merwe
Precious metals: To buy or not to buy -- that is the question. A look at this chart may give you the answer.
Position: Accumulate
Koos van der Merwe
Has been a technical analyst since 1969, and has worked as a futures and options trader with First Financial Futures in Johannesburg, South Africa.
PRINT THIS ARTICLE
ELLIOTT WAVE
Dundee Precious Metals Inc. And The ABCs of Elliott Wave
01/23/04 12:59:01 PMby Koos van der Merwe
Precious metals: To buy or not to buy -- that is the question. A look at this chart may give you the answer.
Position: Accumulate
| Dundee Precious Metals Inc., listed on the Canadian Stock market (CA:DPMA), is a closed-end investment company that provides investors with an opportunity to buy into a managed portfolio of precious metals-related investments. Its principal objectives are capital appreciation and the provision of a hedge against inflation. |
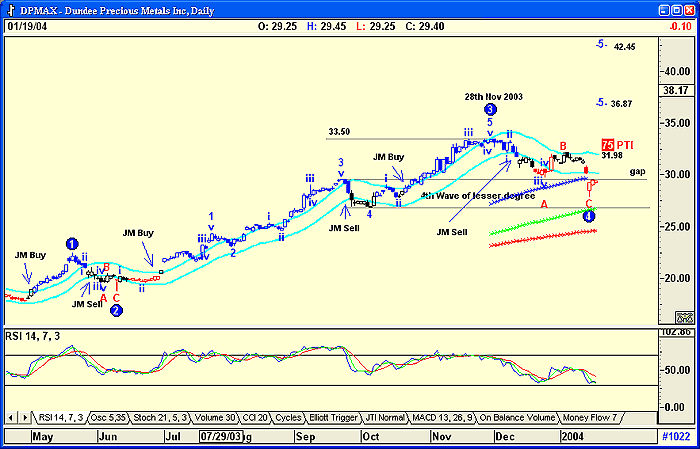
| The first thing you see on the chart is the absolutely classical Elliott wave pattern, automatically drawn by the Advanced GET program I use in my charting. More often than not, I disagree with the wave interpretation of the program, but I have found that when I do agree, it gives me a successful advantage. |

|
| Dundee Precious Metals Canada. |
| Graphic provided by: AdvancedGET. |
| |
| Open to correction on the chart is that in the three wave "abc" retracement from the high of $33.50. It shows wave A as a 5-impulse wave down, and wave C as a simple "abc" (not shown) down. Wave As are usually an "abc" down, and Wave Cs are usually a 5-impulse wave down, (so says the text book) but I must admit that I have met the exception on more than one occasion. |
| The second thing you will see in the chart is the PTI figure of 75. This figure is similar to a probability index. That is, the probability of the wave count being wave 4 with a wave 5 to come as suggested by the program, could be very real. At 75 the probability is pretty high. The program has also calculated two suggested target levels for the wave count. Both targets are based on Fibonacci extensions. Should you buy Dundee Precious Metals Inc.? Only if you are a bottom picker and are prepared to take a gamble. It is far better to wait for a buy signal to be confirmed, either by the indicator giving a buy signal or by a break above the gap as shown on the chart. The more conservative investor can place a buy when the price breaks above the upper JM internal band line. In this chart the JM band is a 15-period moving average offset by 3% in either direction. Today (January 21), that would be a break above $31.98 but this figure will change as the moving average changes. |
| Finally, note that although the company is "Precious Metals" and one thinks immediately of gold, the chart peaked in November 2003, and fell in its ABC pattern as gold was making new highs. This is a share definitely worth watching and can be used almost as an index to the movement of precious metals. |
Has been a technical analyst since 1969, and has worked as a futures and options trader with First Financial Futures in Johannesburg, South Africa.
| Address: | 3256 West 24th Ave |
| Vancouver, BC | |
| Phone # for sales: | 6042634214 |
| E-mail address: | petroosp@gmail.com |
Click here for more information about our publications!
Comments
Date: 01/26/04Rank: 5Comment:

Request Information From Our Sponsors
- StockCharts.com, Inc.
- Candle Patterns
- Candlestick Charting Explained
- Intermarket Technical Analysis
- John Murphy on Chart Analysis
- John Murphy's Chart Pattern Recognition
- John Murphy's Market Message
- MurphyExplainsMarketAnalysis-Intermarket Analysis
- MurphyExplainsMarketAnalysis-Visual Analysis
- StockCharts.com
- Technical Analysis of the Financial Markets
- The Visual Investor
- VectorVest, Inc.
- Executive Premier Workshop
- One-Day Options Course
- OptionsPro
- Retirement Income Workshop
- Sure-Fire Trading Systems (VectorVest, Inc.)
- Trading as a Business Workshop
- VectorVest 7 EOD
- VectorVest 7 RealTime/IntraDay
- VectorVest AutoTester
- VectorVest Educational Services
- VectorVest OnLine
- VectorVest Options Analyzer
- VectorVest ProGraphics v6.0
- VectorVest ProTrader 7
- VectorVest RealTime Derby Tool
- VectorVest Simulator
- VectorVest Variator
- VectorVest Watchdog
