HOT TOPICS LIST
- MACD
- Fibonacci
- RSI
- Gann
- ADXR
- Stochastics
- Volume
- Triangles
- Futures
- Cycles
- Volatility
- ZIGZAG
- MESA
- Retracement
- Aroon
INDICATORS LIST
LIST OF TOPICS
PRINT THIS ARTICLE
by Kevin Hopson
Lackluster performance by oil service stocks the past year has done little to attract investors but looking at the bigger picture, this is one place you will want to be when all is said and done.
Position: Accumulate
Kevin Hopson
Kevin has been a technical analyst for roughly 10 years now. Previously, Kevin owned his own business and acted as a registered investment advisor, specializing in energy. He was also a freelance oil analyst for Orient Trading Co., a commodity futures trading firm in Japan. Kevin is currently a freelance writer.
PRINT THIS ARTICLE
TECHNICAL ANALYSIS
Bullish Signs Abound For The Oil Services Index
01/22/04 09:18:39 AMby Kevin Hopson
Lackluster performance by oil service stocks the past year has done little to attract investors but looking at the bigger picture, this is one place you will want to be when all is said and done.
Position: Accumulate
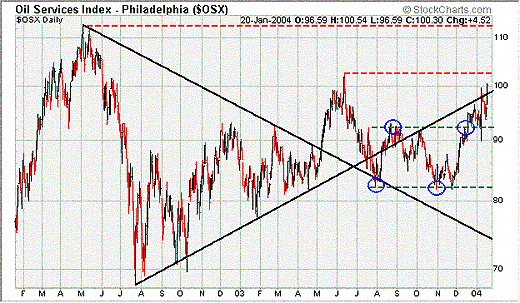
| Though it may appear that the Philadelphia Oil Services Index (OSX) has done little - performance wise - over the past year, a number of bullish signs are pointing to higher prices both short-term and long-term. For example, looking at the two-year chart for the OSX, you will notice that the index formed a large bullish triangle from the summer of 2002 through the spring of 2003. It is considered a "bullish" triangle because the trend prior to this formation was positive (not shown on chart). Since symmetrical triangles tend to act as continuation patterns and the trend was up, a break to the upside would have been anticipated, hence a bullish triangle. |
| Once prices broke the May '02 downtrend line (top of the triangle) last May, the index gave a long-term buy signal. The site of the triangle breakout indicates a potential upside target of 132 for the index. This is calculated by taking the base of the triangle (112 - 68 = 44) and adding it to the point of breakout (88 + 44 = 132). Given the length of time it took for the triangle to form (one year), this price target is longer-term in nature. |

|
| Graphic provided by: Stockcharts.com. |
| |
| Moving ahead to the second half of 2003, you will spot some other bullish developments on the chart. For example, the index bounced off the black downtrend line in July '03. As you probably know, resistance levels tend to act as support once they are broken, and vice-versa. Since the index successfully found support along this downtrend line, it was a good sign for prices. The index moved sideways after this, effectively forming a trading range. When the OSX broke to the upside from this formation last month, it signaled higher prices for the index. |
| The trading range breakout indicates a potential price target between 102 and 112. This is calculated by taking the width of the trading range (92 - 82 = 10), multiplying it by the number of times prices tested the upper channel line in alternate sequence (2) and adding this figure (10 x 2 = 20) to the bottom (82 + 20 = 102) and top (92 + 20 = 112) channel lines. Additionally, this target range coincides with the June '03 and May '02 highs, as illustrated by the dotted red lines. As a result, the 102 - 112 range should act as a good short-term price target for the index, while 132 is a possible objective further down the road. In the meantime, I would accumulate shares of oil service companies, as the long-term upside potential appears to be favorable. |
Kevin has been a technical analyst for roughly 10 years now. Previously, Kevin owned his own business and acted as a registered investment advisor, specializing in energy. He was also a freelance oil analyst for Orient Trading Co., a commodity futures trading firm in Japan. Kevin is currently a freelance writer.
| Glen Allen, VA | |
| E-mail address: | hopson_1@yahoo.com |
Click here for more information about our publications!
Comments
Date: 02/03/04Rank: 5Comment:

Request Information From Our Sponsors
- StockCharts.com, Inc.
- Candle Patterns
- Candlestick Charting Explained
- Intermarket Technical Analysis
- John Murphy on Chart Analysis
- John Murphy's Chart Pattern Recognition
- John Murphy's Market Message
- MurphyExplainsMarketAnalysis-Intermarket Analysis
- MurphyExplainsMarketAnalysis-Visual Analysis
- StockCharts.com
- Technical Analysis of the Financial Markets
- The Visual Investor
- VectorVest, Inc.
- Executive Premier Workshop
- One-Day Options Course
- OptionsPro
- Retirement Income Workshop
- Sure-Fire Trading Systems (VectorVest, Inc.)
- Trading as a Business Workshop
- VectorVest 7 EOD
- VectorVest 7 RealTime/IntraDay
- VectorVest AutoTester
- VectorVest Educational Services
- VectorVest OnLine
- VectorVest Options Analyzer
- VectorVest ProGraphics v6.0
- VectorVest ProTrader 7
- VectorVest RealTime Derby Tool
- VectorVest Simulator
- VectorVest Variator
- VectorVest Watchdog
