HOT TOPICS LIST
- MACD
- Fibonacci
- RSI
- Gann
- ADXR
- Stochastics
- Volume
- Triangles
- Futures
- Cycles
- Volatility
- ZIGZAG
- MESA
- Retracement
- Aroon
INDICATORS LIST
LIST OF TOPICS
PRINT THIS ARTICLE
by Gary Grosschadl
Pfizer (PFE) has come off its recent peak. Is this the start of a bigger downleg or just a normal correction?
Position: Hold
Gary Grosschadl
Independent Canadian equities trader and technical analyst based in Peterborough
Ontario, Canada.
PRINT THIS ARTICLE
ANDREWS PITCH-FORK
Has Pfizer Fizzled?
01/22/04 10:35:03 AMby Gary Grosschadl
Pfizer (PFE) has come off its recent peak. Is this the start of a bigger downleg or just a normal correction?
Position: Hold
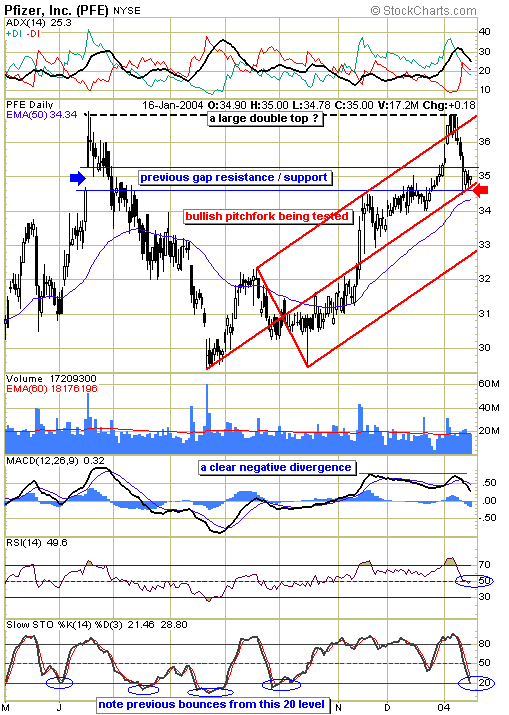
| The daily chart shows what could be the beginning of a double top attempt, but a closer look reveals a more optimistic picture could be evolving. PFE has corrected down into a previous gap area as outlined on the chart. This gap acted as brief support last June and then acted as a resistance zone last December. Now it is acting as support once again as Pfizer appears to be in a brief consolidation. |
| Using three previous pivot points, I have plotted the pitchfork on the chart. The bullish pointing pitchfork shows that the stock initially walked along the median line (center fork) until it made a very bullish move to the upper median line. The next upleg carried the stock in a parallel path until another very bullish thrust punctured the upper median line two weeks ago. Now PFE has corrected down to possible median line support. That this line coincides with the gap zone gives it added significance as a likely bounce area. Note that just below this area lies the 50-day EMA at $34.34, giving another nearby support possibility. |

|
| Pfizer comes down to test two areas of possible support. |
| Graphic provided by: Stockcharts.com. |
| |
| Several indicators also hint at bounce potential here. The directional movement indicator at the top of the chart shows a bearish DI crossover, however it does not look convincing as the DIs have not immediately spread in opposite directions. In other words the cross looks more like a potential whipsaw ready to reverse again. The MACD (moving average convergence/divergence) is noteworthy as it shows a distinct negative divergence to price action which warned that the recent top was not sustainable. The remaining two indicators are both at what often turn out to be potential reversal areas -- the 50 level for the RSI (realtive strength index), and the 20 level for the stochastic indicator. |
| Although I am leaning toward bounce possibilities, the downside chance should also be considered. A move below the 50-day EMA would signal a likely downside move to test the lower median line. Ironically enough, that area below $33 also coincides with another previous gap area from last August. This pichfork, in the longer term, suggests that the uptrend is preserved as long as the lowest "tine" is not violated. Right now the most likely scenario seems to be a bounce off the center median line. |
Independent Canadian equities trader and technical analyst based in Peterborough
Ontario, Canada.
| Website: | www.whatsonsale.ca/financial.html |
| E-mail address: | gwg7@sympatico.ca |
Click here for more information about our publications!
PRINT THIS ARTICLE

|

Request Information From Our Sponsors
- StockCharts.com, Inc.
- Candle Patterns
- Candlestick Charting Explained
- Intermarket Technical Analysis
- John Murphy on Chart Analysis
- John Murphy's Chart Pattern Recognition
- John Murphy's Market Message
- MurphyExplainsMarketAnalysis-Intermarket Analysis
- MurphyExplainsMarketAnalysis-Visual Analysis
- StockCharts.com
- Technical Analysis of the Financial Markets
- The Visual Investor
- VectorVest, Inc.
- Executive Premier Workshop
- One-Day Options Course
- OptionsPro
- Retirement Income Workshop
- Sure-Fire Trading Systems (VectorVest, Inc.)
- Trading as a Business Workshop
- VectorVest 7 EOD
- VectorVest 7 RealTime/IntraDay
- VectorVest AutoTester
- VectorVest Educational Services
- VectorVest OnLine
- VectorVest Options Analyzer
- VectorVest ProGraphics v6.0
- VectorVest ProTrader 7
- VectorVest RealTime Derby Tool
- VectorVest Simulator
- VectorVest Variator
- VectorVest Watchdog
