HOT TOPICS LIST
- MACD
- Fibonacci
- RSI
- Gann
- ADXR
- Stochastics
- Volume
- Triangles
- Futures
- Cycles
- Volatility
- ZIGZAG
- MESA
- Retracement
- Aroon
INDICATORS LIST
LIST OF TOPICS
PRINT THIS ARTICLE
by Gary Grosschadl
Seemingly in sympathy with the overall markets, Tyco makes a move higher. What is the upside?
Position: Buy
Gary Grosschadl
Independent Canadian equities trader and technical analyst based in Peterborough
Ontario, Canada.
PRINT THIS ARTICLE
CHART ANALYSIS
Tyco International Breaks Higher
01/22/04 10:33:30 AMby Gary Grosschadl
Seemingly in sympathy with the overall markets, Tyco makes a move higher. What is the upside?
Position: Buy
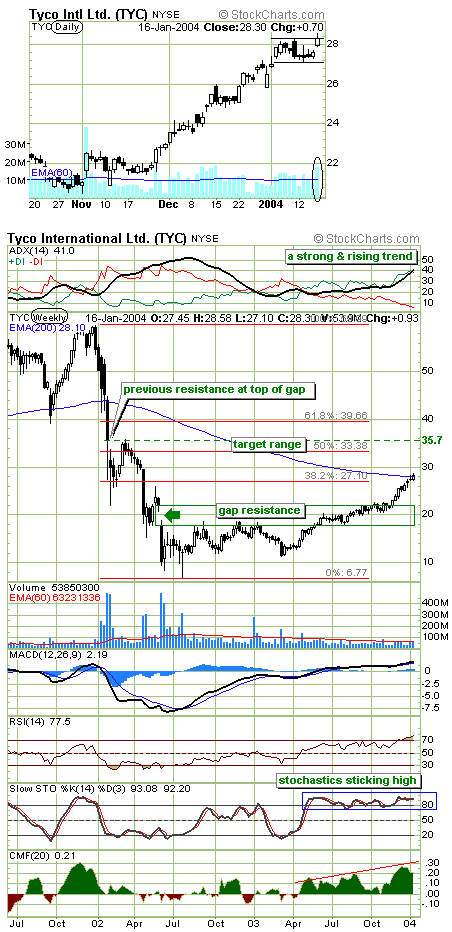
| Tyco's daily chart shows a healthy run from $22 to $28. Now the stock attempts a breakout from its recent consolidation on higher volume. This latest move was also on a gap up, another very bullish sign. |
| In order to determine the potential upside to this move, traders should consult the longer term weekly chart. Here, Tyco has progressed through an earlier wide basing formation from $10 to $19. The next stage was marked by improving trend strength via the chart's uppermost indicator. The bullish DI crossover led a sustained drive into the previous gap, between $18 and $22. Eventually an eight week bullish drive ensued as the ADX strength component steadily rose from 25 to 40. |

|
| Tyco Intl. stock shows an upside move developing. |
| Graphic provided by: Stockcharts.com. |
| |
| Note the price recently broke two upside marks -- a commom Fibonacci level of 38.2% and the often telling 200-week exponential moving average (EMA). Provided that this move is sustainable and the stock can also rise above the psychological round number of $30, the next target area is in sight. |
| Short-term traders would be advised to consider a trading target of $33.38 to $35.70 as shown on the chart. This target zone includes the 50% Fibonacci level and the top of a previous gap. Previous gaps often become significant resistance levels as this chart readily shows on two previous occasions at $35 and $20. |
| In summary, the outlook appears bullish enough to eventually carry the stock higher towards the suggested target zone. However, signs of early failure could come in the shape of the stochastic downleg breaking below the 80 level which most likely would coincide with the stock moving below the 200-week EMA and below the 38.2% Fibonacci level. Should this occur then all bullish bets are off. Prudent traders should always consider both upside and downside scenarios as the market does show a capacity for surprise reversals. |
Independent Canadian equities trader and technical analyst based in Peterborough
Ontario, Canada.
| Website: | www.whatsonsale.ca/financial.html |
| E-mail address: | gwg7@sympatico.ca |
Click here for more information about our publications!
PRINT THIS ARTICLE

Request Information From Our Sponsors
- StockCharts.com, Inc.
- Candle Patterns
- Candlestick Charting Explained
- Intermarket Technical Analysis
- John Murphy on Chart Analysis
- John Murphy's Chart Pattern Recognition
- John Murphy's Market Message
- MurphyExplainsMarketAnalysis-Intermarket Analysis
- MurphyExplainsMarketAnalysis-Visual Analysis
- StockCharts.com
- Technical Analysis of the Financial Markets
- The Visual Investor
- VectorVest, Inc.
- Executive Premier Workshop
- One-Day Options Course
- OptionsPro
- Retirement Income Workshop
- Sure-Fire Trading Systems (VectorVest, Inc.)
- Trading as a Business Workshop
- VectorVest 7 EOD
- VectorVest 7 RealTime/IntraDay
- VectorVest AutoTester
- VectorVest Educational Services
- VectorVest OnLine
- VectorVest Options Analyzer
- VectorVest ProGraphics v6.0
- VectorVest ProTrader 7
- VectorVest RealTime Derby Tool
- VectorVest Simulator
- VectorVest Variator
- VectorVest Watchdog
