HOT TOPICS LIST
- MACD
- Fibonacci
- RSI
- Gann
- ADXR
- Stochastics
- Volume
- Triangles
- Futures
- Cycles
- Volatility
- ZIGZAG
- MESA
- Retracement
- Aroon
INDICATORS LIST
LIST OF TOPICS
PRINT THIS ARTICLE
by Ashwani Gujral
Corning has a failed daily head and shoulder pattern, but has a successful bullish flag breakout on the weekly chart. This example underlines the need to examine evidence across time frames and indicators.
Position: Buy
Ashwani Gujral
He is founder of AGIP Securities Pvt. Ltd. which offers money management services, live chat rooms (during market hours) and independent technical analysis consultancy. The company has a big media presence from the likes of CNBC, NDTV Profit, and ZEE Business.
PRINT THIS ARTICLE
FLAGS AND PENNANTS
Corning Moves Up Sharply
01/23/04 01:47:15 PMby Ashwani Gujral
Corning has a failed daily head and shoulder pattern, but has a successful bullish flag breakout on the weekly chart. This example underlines the need to examine evidence across time frames and indicators.
Position: Buy
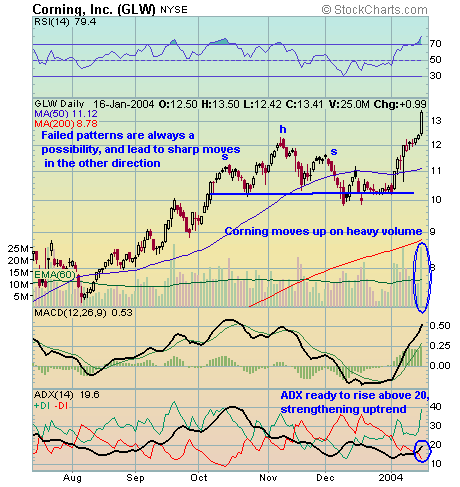
| The head and shoulders pattern is successful about 95% of the time, but occasionally it fails, as shown in Corning's daily chart. This generally happens when patterns in two time frames are contradictory. In this case, the pattern in the higher time frame always prevails. Pattern breakouts on low volume are always suspect, so I look for high volume breakouts in all patterns. Corning broke out on heavy volume, making the chance of a false breakout small. |
| While technical analysis literature emphasizes beautiful, successful patterns, there is much less discussion about failed patterns. When they fail though, they can lead to sharp moves in the opposite direction, as traders who are trapped in the direction of expected breakout exit the market. I would advise traders not to preempt the final breakout, and if they do, to keep a stop-loss above/below the right shoulder. |

|
| Figure 1: Daily chart of Corning. |
| Graphic provided by: Stockcharts.com. |
| |
| On the daily chart, Corning moved up sharply and suffered a failed head and shoulders pattern. It can now be treated as a range breakout to the upside with a target of $15. As you can see, the head and shoulders had less than average volume as the right shoulder broke down. Even if traders don't see signs of a pattern failure, it is critical that they place a stop. If there is a move to the upside, it can be steep. At this point, volume to the upside is higher and the MACD histogram is moving consistently higher, with nothing indicating a downside a breakout. |
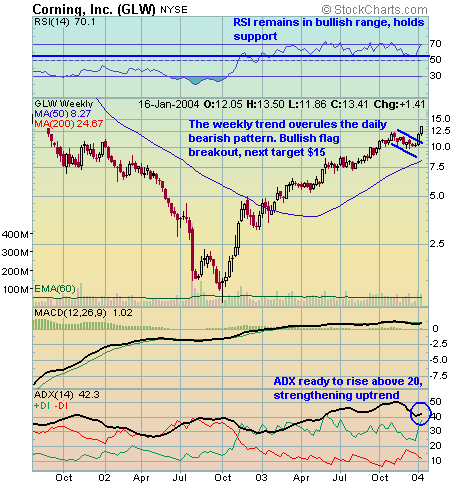
 Figure 2: Weekly chart of Corning. On the weekly chart, Corning was tracing out a flag consolidation pattern. The failed head and shoulders on the daily chart simply shows up as a flag breakout on the weekly chart. A flag pattern is generally a pause in an ongoing trend and provides excellent low risk entries into strong trending markets. Target of flags are determined by adding the move before the flag to the breakout point. The target of the weekly flag is $15. The weekly RSI consistently remains in the bullish range. The weekly ADX consistently remains above 30, showing no sign of weakness in the weekly trend. |
| To review the main points in my article: 1. Patterns can and do fail and traders should always be open to the possibility. 2. Pattern breakout/breakdown should occur with volume. 3. Failed patterns lead to large moves, so even if your stop-loss is hit on a failed pattern, you can reverse your bet; it will be worthwhile. 4. Patterns should be seen in the context of at least two time frames. |
He is founder of AGIP Securities Pvt. Ltd. which offers money management services, live chat rooms (during market hours) and independent technical analysis consultancy. The company has a big media presence from the likes of CNBC, NDTV Profit, and ZEE Business.
| Title: | Chief mkt strategist |
| Company: | AGIP Securities |
| India | |
| Phone # for sales: | 9871066337 |
| Website: | www.ashwanigujral.com |
| E-mail address: | contact@ashwanigujral.com |
Traders' Resource Links | |
| AGIP Securities has not added any product or service information to TRADERS' RESOURCE. | |
Click here for more information about our publications!
Comments

Request Information From Our Sponsors
- StockCharts.com, Inc.
- Candle Patterns
- Candlestick Charting Explained
- Intermarket Technical Analysis
- John Murphy on Chart Analysis
- John Murphy's Chart Pattern Recognition
- John Murphy's Market Message
- MurphyExplainsMarketAnalysis-Intermarket Analysis
- MurphyExplainsMarketAnalysis-Visual Analysis
- StockCharts.com
- Technical Analysis of the Financial Markets
- The Visual Investor
- VectorVest, Inc.
- Executive Premier Workshop
- One-Day Options Course
- OptionsPro
- Retirement Income Workshop
- Sure-Fire Trading Systems (VectorVest, Inc.)
- Trading as a Business Workshop
- VectorVest 7 EOD
- VectorVest 7 RealTime/IntraDay
- VectorVest AutoTester
- VectorVest Educational Services
- VectorVest OnLine
- VectorVest Options Analyzer
- VectorVest ProGraphics v6.0
- VectorVest ProTrader 7
- VectorVest RealTime Derby Tool
- VectorVest Simulator
- VectorVest Variator
- VectorVest Watchdog
