HOT TOPICS LIST
- MACD
- Fibonacci
- RSI
- Gann
- ADXR
- Stochastics
- Volume
- Triangles
- Futures
- Cycles
- Volatility
- ZIGZAG
- MESA
- Retracement
- Aroon
INDICATORS LIST
LIST OF TOPICS
PRINT THIS ARTICLE
by Kevin Hopson
The U.S. Dollar Index has been showing signs of reversing for some time now but is the recent bounce the beginning of a more serious correction or is it just a weak attempt to push prices higher?
Position: Hold
Kevin Hopson
Kevin has been a technical analyst for roughly 10 years now. Previously, Kevin owned his own business and acted as a registered investment advisor, specializing in energy. He was also a freelance oil analyst for Orient Trading Co., a commodity futures trading firm in Japan. Kevin is currently a freelance writer.
PRINT THIS ARTICLE
TECHNICAL ANALYSIS
Strength In The U.S. Dollar Index
01/20/04 09:09:36 AMby Kevin Hopson
The U.S. Dollar Index has been showing signs of reversing for some time now but is the recent bounce the beginning of a more serious correction or is it just a weak attempt to push prices higher?
Position: Hold
| I have been following the U.S. dollar index ($USD) for the past several weeks and have written on this subject a couple of times recently. Both times I highlighted the possibility of a correction in the dollar, as short-term and long-term bullish divergences on the chart have been signaling a forthcoming bottom reversal in the index. Last week, the U.S. dollar index rallied, showing signs of recovering after a long and slow descent over the past few months. However, it is too soon to tell if the U.S. dollar has already weathered the storm or if this is just a minor correction before a more significant downward move. |
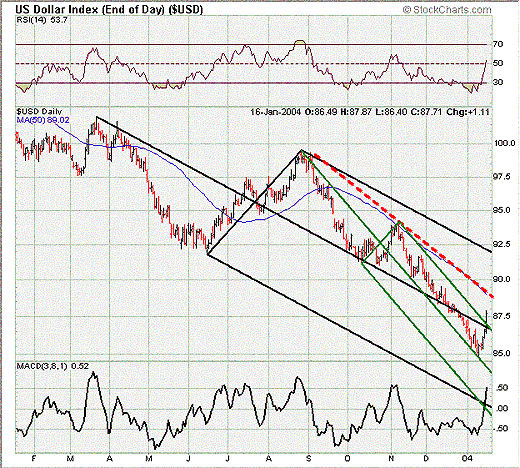
| Before presenting "what if" scenarios, I will focus on what actually occurred last week. Looking at the one-year chart for the U.S. dollar index, you will notice that prices have been contained within the top channel of the green pitchfork since early November 2003. Additionally, the index recently broke below the median line of the black pitchfork, which had acted as support since last October. However, during last week's rally, the index moved above the top green parallel line and the black median line, which had both converged in the $86.50 to $87.00 range. As a result, the short-term picture has turned bullish. |

|
| Graphic provided by: Stockcharts.com. |
| |
| If this correction is going to amount to anything down the road, the index will have to do a couple of things. First, prices will have to overcome additional resistance around the $89.00 level. This is the site of the index's 50-day moving average ($89.02) and last August's downtrend line (dotted red line). Secondly, the index will have to break the top parallel line of the black pitchfork, which currently comes into play around the $92.00 level. Because the falling black pitchfork has contained prices since last summer, a move above the top parallel line is necessary for the intermediate technicals to turn bullish. In the meantime, I would remain on the sidelines and take a wait-and-see approach. |
Kevin has been a technical analyst for roughly 10 years now. Previously, Kevin owned his own business and acted as a registered investment advisor, specializing in energy. He was also a freelance oil analyst for Orient Trading Co., a commodity futures trading firm in Japan. Kevin is currently a freelance writer.
| Glen Allen, VA | |
| E-mail address: | hopson_1@yahoo.com |
Click here for more information about our publications!
PRINT THIS ARTICLE

Request Information From Our Sponsors
- StockCharts.com, Inc.
- Candle Patterns
- Candlestick Charting Explained
- Intermarket Technical Analysis
- John Murphy on Chart Analysis
- John Murphy's Chart Pattern Recognition
- John Murphy's Market Message
- MurphyExplainsMarketAnalysis-Intermarket Analysis
- MurphyExplainsMarketAnalysis-Visual Analysis
- StockCharts.com
- Technical Analysis of the Financial Markets
- The Visual Investor
- VectorVest, Inc.
- Executive Premier Workshop
- One-Day Options Course
- OptionsPro
- Retirement Income Workshop
- Sure-Fire Trading Systems (VectorVest, Inc.)
- Trading as a Business Workshop
- VectorVest 7 EOD
- VectorVest 7 RealTime/IntraDay
- VectorVest AutoTester
- VectorVest Educational Services
- VectorVest OnLine
- VectorVest Options Analyzer
- VectorVest ProGraphics v6.0
- VectorVest ProTrader 7
- VectorVest RealTime Derby Tool
- VectorVest Simulator
- VectorVest Variator
- VectorVest Watchdog
