HOT TOPICS LIST
- MACD
- Fibonacci
- RSI
- Gann
- ADXR
- Stochastics
- Volume
- Triangles
- Futures
- Cycles
- Volatility
- ZIGZAG
- MESA
- Retracement
- Aroon
INDICATORS LIST
LIST OF TOPICS
PRINT THIS ARTICLE
by Ashwani Gujral
Biotechs are a key part of the Nasdaq index. The Nasdaq has broken out of its consolidation and its strength will naturally rub off on those constituent sectors that were also consolidating. The biotech index is one such sector and new 52 week highs are imminent.
Position: Buy
Ashwani Gujral
He is founder of AGIP Securities Pvt. Ltd. which offers money management services, live chat rooms (during market hours) and independent technical analysis consultancy. The company has a big media presence from the likes of CNBC, NDTV Profit, and ZEE Business.
PRINT THIS ARTICLE
CONSOLID FORMATION
Biotechs Ready To Break Out Of Consolidation
01/19/04 09:41:31 AMby Ashwani Gujral
Biotechs are a key part of the Nasdaq index. The Nasdaq has broken out of its consolidation and its strength will naturally rub off on those constituent sectors that were also consolidating. The biotech index is one such sector and new 52 week highs are imminent.
Position: Buy
| The biotech index rose off its bottom of about 250, going all the way to 500. After such a hectic move, it consolidated for about eight months. Now it seems ready for a breakout to a target of 625. Sideways consolidations offer an excellent entry point to sectors/stocks that were running up at full steam earlier. The bottom of the consolidation is an excellent place for a stop-loss. |
| In an earlier article I discussed the Nasdaq's breakout, seemingly headed to 2700. The next level of analysis is at the sector level and the biotech sector, along with many others in Nasdaq, are breaking out of sideways consolidation too. Once a sector has broken out, it is reasonable to assume a number of leading stocks in the sector are doing so too and traders can go long in those stocks. |

|
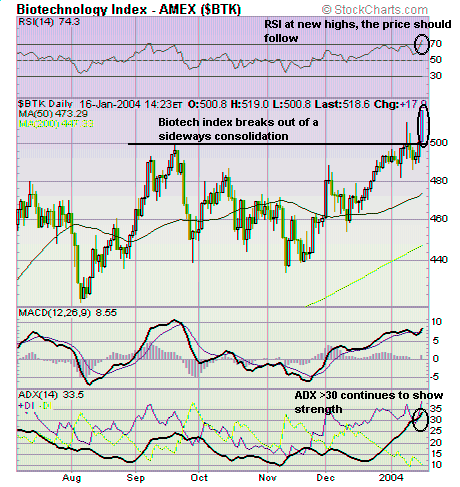
| Figure 1: Daily chart of the Biotech index. |
| Graphic provided by: Stockcharts.com. |
| |
| In the daily chart the Biotech index is about to break out above a key 500 level. The ADX is greater than 30, showing a trending move can be expected. The RSI is making a new high and the stock can be expected to do the same. The MACD histogram has started rising above the zero level again, providing advance indication of a breakout. Now look at the weekly charts for confirmation. |
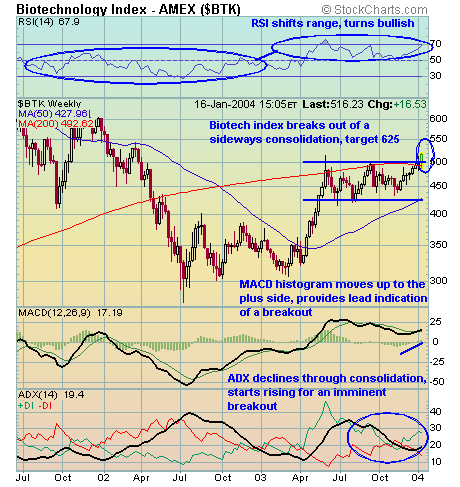
 Figure 2: Weekly chart of Biotech index. The weekly chart shows the Biotech index clearly breaking out of an 8-month consolidation range which had followed a heady rise from about 250 to 500. So all traders who missed the getting in the first time have another opportunity. The weekly RSI has shifted its range from bearish to bullish, confirming our bullish stance. The MACD histogram's rise to the plus side indicates an imminent breakout. I have found the best part about the MACD is its histogram because of its leading indicator properties. The moving averages are good for trend following but the MACD histogram provides leading indications of an price move. The ADX, which had declined below 20 signaling consolidation, is now heading back up as a trending move is expected to begin. |
| The key is to follow a top down analysis in this order: Market indexes (Nasdaq), sector indexes (Biotechs), and stocks (leading biotech stocks). This is a fail-safe way to reach the strongest stocks in the markets. Markets, sectors and stocks move in trends. Identifying simultaneous moves in all three is the surest way of making money. |
He is founder of AGIP Securities Pvt. Ltd. which offers money management services, live chat rooms (during market hours) and independent technical analysis consultancy. The company has a big media presence from the likes of CNBC, NDTV Profit, and ZEE Business.
| Title: | Chief mkt strategist |
| Company: | AGIP Securities |
| India | |
| Phone # for sales: | 9871066337 |
| Website: | www.ashwanigujral.com |
| E-mail address: | contact@ashwanigujral.com |
Traders' Resource Links | |
| AGIP Securities has not added any product or service information to TRADERS' RESOURCE. | |
Click here for more information about our publications!
PRINT THIS ARTICLE

Request Information From Our Sponsors
- StockCharts.com, Inc.
- Candle Patterns
- Candlestick Charting Explained
- Intermarket Technical Analysis
- John Murphy on Chart Analysis
- John Murphy's Chart Pattern Recognition
- John Murphy's Market Message
- MurphyExplainsMarketAnalysis-Intermarket Analysis
- MurphyExplainsMarketAnalysis-Visual Analysis
- StockCharts.com
- Technical Analysis of the Financial Markets
- The Visual Investor
- VectorVest, Inc.
- Executive Premier Workshop
- One-Day Options Course
- OptionsPro
- Retirement Income Workshop
- Sure-Fire Trading Systems (VectorVest, Inc.)
- Trading as a Business Workshop
- VectorVest 7 EOD
- VectorVest 7 RealTime/IntraDay
- VectorVest AutoTester
- VectorVest Educational Services
- VectorVest OnLine
- VectorVest Options Analyzer
- VectorVest ProGraphics v6.0
- VectorVest ProTrader 7
- VectorVest RealTime Derby Tool
- VectorVest Simulator
- VectorVest Variator
- VectorVest Watchdog
