HOT TOPICS LIST
- MACD
- Fibonacci
- RSI
- Gann
- ADXR
- Stochastics
- Volume
- Triangles
- Futures
- Cycles
- Volatility
- ZIGZAG
- MESA
- Retracement
- Aroon
INDICATORS LIST
LIST OF TOPICS
PRINT THIS ARTICLE
by Ashwani Gujral
The dollar is going through an upward technical correction while in a downtrend, whereas gold and crude oil are going through a downward correction in an uptrend. Has the downtrend ended for the dollar and the uptrend ended for gold and crude? I don't know. I only know that tops and bottoms are generally not made in a day.
Position: N/A
Ashwani Gujral
He is founder of AGIP Securities Pvt. Ltd. which offers money management services, live chat rooms (during market hours) and independent technical analysis consultancy. The company has a big media presence from the likes of CNBC, NDTV Profit, and ZEE Business.
PRINT THIS ARTICLE
RETRACEMENT
How The U.S. Dollar Relates To Gold And Crude Oil
01/19/04 10:45:05 AMby Ashwani Gujral
The dollar is going through an upward technical correction while in a downtrend, whereas gold and crude oil are going through a downward correction in an uptrend. Has the downtrend ended for the dollar and the uptrend ended for gold and crude? I don't know. I only know that tops and bottoms are generally not made in a day.
Position: N/A
| The U.S. dollar is related to commodities like gold and crude oil. You only need to look at their charts to see their inverse relationship. As the U.S. dollar corrects upwards after a sustained downmove and gold and oil corrects downwards after an upmove, l will try to find their critical support/resistance levels using Fibonacci analysis. Traders should remember a market tops out when the strong players want to distribute their holdings to the weaker players without tipping their hand that the market is topping out. Market tops are known for their volatility, whereas market bottoms are known for their quiet trading and long basing patterns. An easy way to identify topping out patterns is if they form a series of lower highs and lower lows, and bottoming out would be the reverse: higher highs and higher lows on the chart. As far as the charts are showing, neither the dollar nor gold and crude oil are showing any such patterns. Now look at their daily charts in detail. |

|
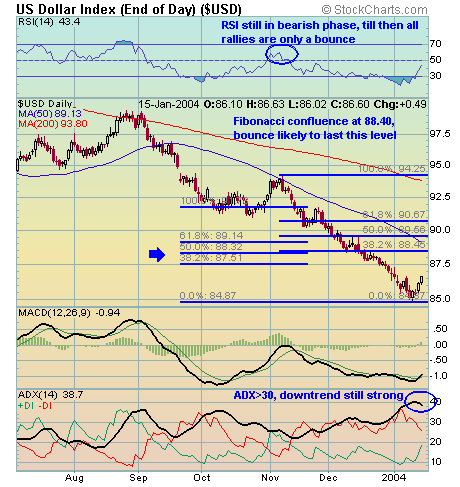
| Figure 1: Daily chart of the USD. |
| Graphic provided by: Supercharts.com. |
| |
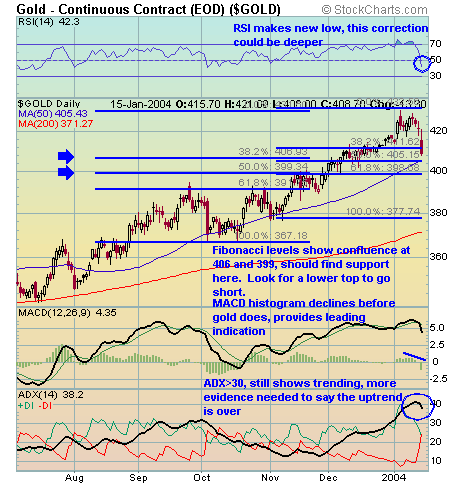
The daily chart of the U.S. dollar shows it going through an upward correction to the strong downtrend it has seen over the last many months. I constructed the Fibonacci retracement through point 1 and 2 and got a confluence level of 88.4. This level is likely to provide a lot of resistance to this ongoing bounce. The ADX is still over 30 so there is no evidence that the downtrend is ending. I would wait for a higher bottom before looking to go long on the dollar. Taking out a higher pivot would show strength in the rise. Until then a bounce is all this is, and traders should go short. Downtrends usually end in long basing patterns and I believe the dollar will have to go through that before it bottoms out. Figure 2: Daily chart of gold. Gold has been in an uptrend while the dollar has been declining. So it is inversely related to the dollar. This makes intuitive sense because when the U.S. dollar is weak, most investors worldwide park their money in gold. As the U.S. dollar has corrected upwards, gold has corrected downwards. But the trends in both remain strong as shown by an ADX above 30, and the trends will stay intact until bottoming and topping out patterns form. The Fibonacci confluence levels for gold are 406 and 399. They should act as strong support and traders should look to go long on all corrections. |
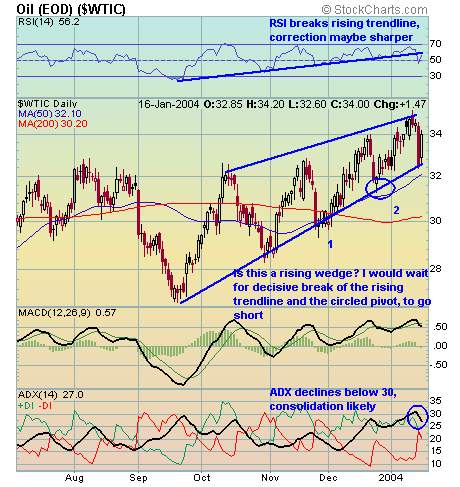
 Figure 2: Daily chart of oil. Oil has been rising steadily, though not as spectacularly, as gold. This chart also shows that oil is inversely related to the dollar. This makes sense as, contrary to common knowledge, not only is the price of crude oil related to the price of heating oil, which is important at other times, but oil is strong and is expected to continue so as oil producing countries get dollars for their oil. And since the dollar is weak, they get less in their currency for the oil they are selling. Hence the talk of production cuts, reflected in the charts. Oil has been in an upward channel with a series of higher highs and lows. This channel is beginning to look like a bearish wedge but confirmation will occur only when the lower trendline is broken. Until then oil remains in a mild uptrend, perhaps anticipating downward pressure when winter ends and demand slackens. A likely scenario is that it consolidates at these levels as the ADX declines below 30 as long as the dollar does not bottom out. |
| The three charts above prove the dollar is inversely related to both gold and oil prices. But the time to reverse bets hasn't come yet as none of them are looking to reverse trend. |
He is founder of AGIP Securities Pvt. Ltd. which offers money management services, live chat rooms (during market hours) and independent technical analysis consultancy. The company has a big media presence from the likes of CNBC, NDTV Profit, and ZEE Business.
| Title: | Chief mkt strategist |
| Company: | AGIP Securities |
| India | |
| Phone # for sales: | 9871066337 |
| Website: | www.ashwanigujral.com |
| E-mail address: | contact@ashwanigujral.com |
Traders' Resource Links | |
| AGIP Securities has not added any product or service information to TRADERS' RESOURCE. | |
Click here for more information about our publications!
Comments
Date: 01/24/04Rank: 5Comment:
Date: 01/26/04Rank: 5Comment:
Date: 02/03/04Rank: 5Comment:

Request Information From Our Sponsors
- StockCharts.com, Inc.
- Candle Patterns
- Candlestick Charting Explained
- Intermarket Technical Analysis
- John Murphy on Chart Analysis
- John Murphy's Chart Pattern Recognition
- John Murphy's Market Message
- MurphyExplainsMarketAnalysis-Intermarket Analysis
- MurphyExplainsMarketAnalysis-Visual Analysis
- StockCharts.com
- Technical Analysis of the Financial Markets
- The Visual Investor
- VectorVest, Inc.
- Executive Premier Workshop
- One-Day Options Course
- OptionsPro
- Retirement Income Workshop
- Sure-Fire Trading Systems (VectorVest, Inc.)
- Trading as a Business Workshop
- VectorVest 7 EOD
- VectorVest 7 RealTime/IntraDay
- VectorVest AutoTester
- VectorVest Educational Services
- VectorVest OnLine
- VectorVest Options Analyzer
- VectorVest ProGraphics v6.0
- VectorVest ProTrader 7
- VectorVest RealTime Derby Tool
- VectorVest Simulator
- VectorVest Variator
- VectorVest Watchdog
