HOT TOPICS LIST
- MACD
- Fibonacci
- RSI
- Gann
- ADXR
- Stochastics
- Volume
- Triangles
- Futures
- Cycles
- Volatility
- ZIGZAG
- MESA
- Retracement
- Aroon
INDICATORS LIST
LIST OF TOPICS
PRINT THIS ARTICLE
by Gary Grosschadl
Gold has been battered lately so it's time once again to consider buying the next gold bounce.
Position: Buy
Gary Grosschadl
Independent Canadian equities trader and technical analyst based in Peterborough
Ontario, Canada.
PRINT THIS ARTICLE
CHART ANALYSIS
Looking For A Gold Bounce
01/19/04 09:51:32 AMby Gary Grosschadl
Gold has been battered lately so it's time once again to consider buying the next gold bounce.
Position: Buy
| Gold prices fell 3.2 percent Thursday, the biggest one-day drop in three months. Gold for February delivery fell $13.30 to $408.70 an ounce on the Comex division of the New York Mercantile Exchange, the biggest drop for a most-active futures contract since October 3. Spot gold fell by $13.30 to $408.40. No doubt the big gold traders (investment houses, fund managers) were dancing close to the exits as the last gold spike above $430 raised a few eyebrows. |
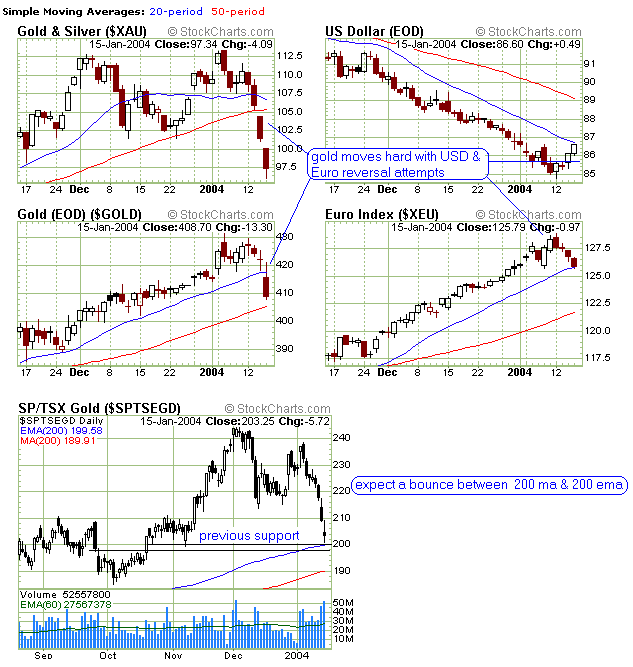
| Gold traders keep a wary eye on the U.S. dollar index and the Euro index and both of these were suggesting a possible reversal -- further incentive to take gold profits. Now as the gold index has been driven down the last four trading sessions and the USD and the Euro approach possible early support and resistance marks, traders ponder another reversal. |

|
| Gold prices and indices react strongly to reversal action for the USD and Euro indexes. |
| Graphic provided by: Stockcharts.com. |
| |
| As the charts show, there are several areas of support and resistance that may soon come into play. The USD index is at its overhead 20-day moving average while the Euro index has reached the opposite counterpart via its 20-day moving average. These will be the first support and resistance tests for these indexes. More prominently the chart of the TSX gold index (similar to the XAU index) shows the often important 200-day exponential moving average. I prefer using the 200-period exponential moving average over the simple moving average (SMA) as it is often more responsive to shorter term movements (it is weighted to take the more recent price fluctuations into consideration). Also this area where the 200-period EMA lies coincides with a previous support area as well as a previous area of congestion noted at the extreme left of the TSX gold chart. However it may be more prudent to simply say. . . watch for a possible bounce between the two areas marked by the 200-day moving averages. |
Independent Canadian equities trader and technical analyst based in Peterborough
Ontario, Canada.
| Website: | www.whatsonsale.ca/financial.html |
| E-mail address: | gwg7@sympatico.ca |
Click here for more information about our publications!
PRINT THIS ARTICLE

Request Information From Our Sponsors
- VectorVest, Inc.
- Executive Premier Workshop
- One-Day Options Course
- OptionsPro
- Retirement Income Workshop
- Sure-Fire Trading Systems (VectorVest, Inc.)
- Trading as a Business Workshop
- VectorVest 7 EOD
- VectorVest 7 RealTime/IntraDay
- VectorVest AutoTester
- VectorVest Educational Services
- VectorVest OnLine
- VectorVest Options Analyzer
- VectorVest ProGraphics v6.0
- VectorVest ProTrader 7
- VectorVest RealTime Derby Tool
- VectorVest Simulator
- VectorVest Variator
- VectorVest Watchdog
- StockCharts.com, Inc.
- Candle Patterns
- Candlestick Charting Explained
- Intermarket Technical Analysis
- John Murphy on Chart Analysis
- John Murphy's Chart Pattern Recognition
- John Murphy's Market Message
- MurphyExplainsMarketAnalysis-Intermarket Analysis
- MurphyExplainsMarketAnalysis-Visual Analysis
- StockCharts.com
- Technical Analysis of the Financial Markets
- The Visual Investor
