HOT TOPICS LIST
- MACD
- Fibonacci
- RSI
- Gann
- ADXR
- Stochastics
- Volume
- Triangles
- Futures
- Cycles
- Volatility
- ZIGZAG
- MESA
- Retracement
- Aroon
INDICATORS LIST
LIST OF TOPICS
PRINT THIS ARTICLE
by Matt Blackman
It's had its ups and downs in the last few years but from a technical point, this stock could be getting ready for a summit attempt.
Position: N/A
Matt Blackman
Matt Blackman is a full-time technical and financial writer and trader. He produces corporate and financial newsletters, and assists clients in getting published in the mainstream media. He is the host of TradeSystemGuru.com. Matt has earned the Chartered Market Technician (CMT) designation. Find out what stocks and futures Matt is watching on Twitter at www.twitter.com/RatioTrade
PRINT THIS ARTICLE
CHART ANALYSIS
American Eagle Outfitters Ready For Another Summit?
01/16/04 11:54:51 AMby Matt Blackman
It's had its ups and downs in the last few years but from a technical point, this stock could be getting ready for a summit attempt.
Position: N/A
| Between June 2000 and February 2001 when many other stocks were heading for the cellar, American Eagle Outfitters (AEOS - Nasdaq) made a break for the peak. It went from a low of $7.75 on June 21, 2000 before hitting a high of just over $40.00 the following February -- very close to five times its low. Not bad in eight months! The stock has demonstrated extreme volatility since then but drifted mostly lower before hitting a low in October 2002 of $9.75. |
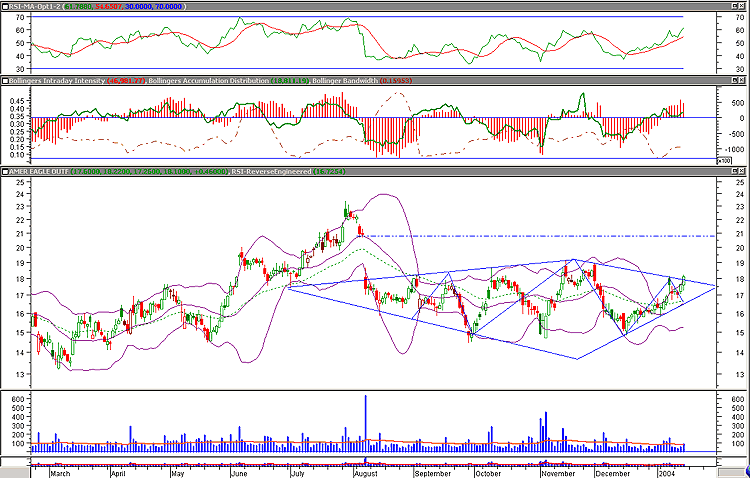
| Since hitting a high of $23.70 in July 2003, after which time it gapped down on quarterly earnings that plummeted from $0.54 to $0.09, the stock has been toe-nailing its way back toward base camp to get ready for another summit attempt. One service I use sent out an alert on January 15th that the stock had completed a diamond bottom pattern with a project targeted based on the formation of $22-$23. |

|
| Figure 1 – Daily chart of American Eagle Outfitters (AEOS) showing a diamond bottom formation (blue solid lines), gap (dashed blue line), and a historic low volatility (Bollinger Bandwidth). Taken together with positive divergence between the accumulation distribution index developed by Larry Williams (green line in second window from the top), intraday intensity, RSI and price, it spells a potential breakout. Pattern recognition by Recognia.com. |
| Graphic provided by: MetaStock. |
| |
| A look at the chart revealed some other interesting patterns. First, it appears to be completing a potential island reversal pattern with a gap target of $20.87 that wants to be filled. Secondly, the stock is showing the lowest volatility in more than five years with a Bollinger Bandwidth reading of 0.073. According to John Bollinger in his recent book, Bollinger on Bollinger Bands, a six-month low volatility usually means a breakout and spells "The Squeeze." As Bollinger says, "Bollinger Bands are driven by volatility and The Squeeze is a pure reflection of that volatility," and one of the most reliable Bollinger Band set-ups. |
| Taken together, this stock could be getting ready for one heck of a ride but with a first gap target at $20.87 and a diamond bottom target of $22.00 to $23.00, no point in getting carried away. I almost forgot to mention that the fundamentals are looking quite interesting as well. Quarterly revenues have been making a positive comeback in the last two quarters. The price/earnings ratio is a reasonable 19.4 (89% of the industry average) given the state of this market. It also boasts a modest price-to-book ratio of 1.99 and price-to-sales ratio of 0.83. AEOS also has a very low debt to equity ratio at less than 8% of the retail apparel industry average. As long as interest rates remain low and consumers keep spending, this stock has a good chance to mount another summit attempt in the near future, especially with a market warm thermal wind to lighten its load. |
| SUGGESTED READING: Bollinger, John [2002], "Bollinger on Bollinger Bands," McGraw-Hill Technical Analysis Patterns http://www.recognia.com/reference/techanalysis.htm |
Matt Blackman is a full-time technical and financial writer and trader. He produces corporate and financial newsletters, and assists clients in getting published in the mainstream media. He is the host of TradeSystemGuru.com. Matt has earned the Chartered Market Technician (CMT) designation. Find out what stocks and futures Matt is watching on Twitter at www.twitter.com/RatioTrade
| Company: | TradeSystemGuru.com |
| Address: | Box 2589 |
| Garibaldi Highlands, BC Canada | |
| Phone # for sales: | 604-898-9069 |
| Fax: | 604-898-9069 |
| Website: | www.tradesystemguru.com |
| E-mail address: | indextradermb@gmail.com |
Traders' Resource Links | |
| TradeSystemGuru.com has not added any product or service information to TRADERS' RESOURCE. | |
Click here for more information about our publications!
PRINT THIS ARTICLE

Request Information From Our Sponsors
- StockCharts.com, Inc.
- Candle Patterns
- Candlestick Charting Explained
- Intermarket Technical Analysis
- John Murphy on Chart Analysis
- John Murphy's Chart Pattern Recognition
- John Murphy's Market Message
- MurphyExplainsMarketAnalysis-Intermarket Analysis
- MurphyExplainsMarketAnalysis-Visual Analysis
- StockCharts.com
- Technical Analysis of the Financial Markets
- The Visual Investor
- VectorVest, Inc.
- Executive Premier Workshop
- One-Day Options Course
- OptionsPro
- Retirement Income Workshop
- Sure-Fire Trading Systems (VectorVest, Inc.)
- Trading as a Business Workshop
- VectorVest 7 EOD
- VectorVest 7 RealTime/IntraDay
- VectorVest AutoTester
- VectorVest Educational Services
- VectorVest OnLine
- VectorVest Options Analyzer
- VectorVest ProGraphics v6.0
- VectorVest ProTrader 7
- VectorVest RealTime Derby Tool
- VectorVest Simulator
- VectorVest Variator
- VectorVest Watchdog
