HOT TOPICS LIST
- MACD
- Fibonacci
- RSI
- Gann
- ADXR
- Stochastics
- Volume
- Triangles
- Futures
- Cycles
- Volatility
- ZIGZAG
- MESA
- Retracement
- Aroon
INDICATORS LIST
LIST OF TOPICS
PRINT THIS ARTICLE
by Kevin Hopson
Natural gas prices have moved higher in recent weeks, as predicted, but has the uptrend reversed?
Position: N/A
Kevin Hopson
Kevin has been a technical analyst for roughly 10 years now. Previously, Kevin owned his own business and acted as a registered investment advisor, specializing in energy. He was also a freelance oil analyst for Orient Trading Co., a commodity futures trading firm in Japan. Kevin is currently a freelance writer.
PRINT THIS ARTICLE
ELLIOTT WAVE
Has Natural Gas Topped Out?
01/16/04 10:22:09 AMby Kevin Hopson
Natural gas prices have moved higher in recent weeks, as predicted, but has the uptrend reversed?
Position: N/A
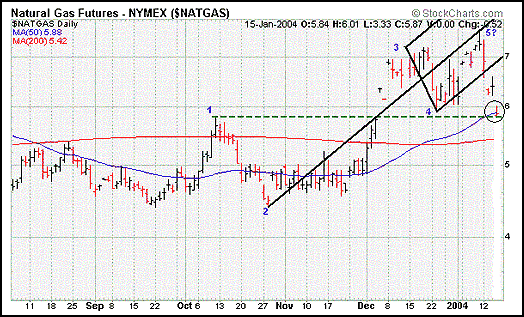
| When I touched on natural gas late last year, I was calling for higher prices in the near-term. More specifically, I said that natural gas was likely in the third wave of an uptrend, meaning that prices should eventually surpass the wave 1 high around the $5.80 level. As you can see in the chart, this occurred in early December. However, much has happened since then. |
| If you look at the estimated wave count, the uptrend may have already run its course. The median line of the 2-3/4 pitchfork is sometimes used to predict the completion point of wave 5 - or the end of the trend - and you will notice that the black median line turned away prices perfectly. Additionally, the test of the median line occurred above the wave 3 high. As a result, you could conclude that the trend has reversed. |

|
| Figure 1: Continuous contract chart for natural gas. |
| Graphic provided by: Stockcharts.com. |
| |
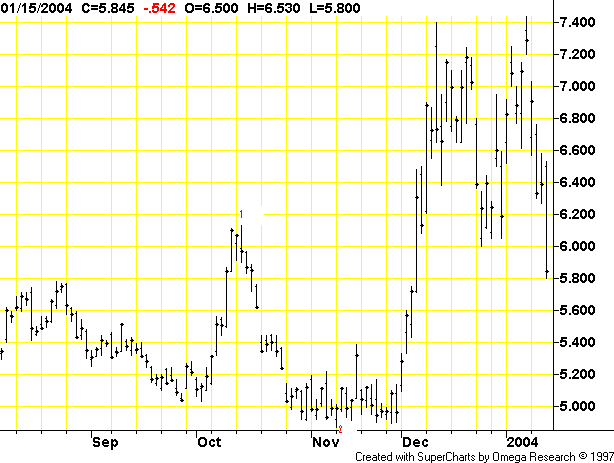
| Unfortunately, the wave count appears to be weak. For one thing, Figure 1 shows a continuous price contract, meaning that prices from each new front-month futures contract are incorporated into the chart. This can create slight discrepancies in price. For example, the February '04 natural gas contract (Figure 2) shows pivot point 2 being lower than the starting point of the trend for the continuous contract. As a result, if you were to go with the February contract, the wave count would be entirely different. |
 Figure 2: February '04 natural gas contract. Additionally, the 0-1/2 and 1-2/3 pitchforks are often used to predict the third and fourth pivot points, respectively. Although these pitchforks are not drawn in the chart (pivot point 1 is on the chart and point 0 doesn't appear), they failed to predict the completion points of waves 3 and 4. As a result, I am not very confident in the estimated wave count for the continuous contract. However, since this chart represents the historical pricing of prior front-month contracts (as well as the current one), it must be factored into the equation. |
| In the meantime, I would watch the $5.80 level for signs of further weakness. This is the site of last December's double top breakout. Prices successfully bounced off support here on Thursday (Jan. 15), effectively filling December's breakout gap in the process. If this level fails to hold in the near-term, natural gas prices could look to test the 200-day moving average down around the $5.40 level. |
Kevin has been a technical analyst for roughly 10 years now. Previously, Kevin owned his own business and acted as a registered investment advisor, specializing in energy. He was also a freelance oil analyst for Orient Trading Co., a commodity futures trading firm in Japan. Kevin is currently a freelance writer.
| Glen Allen, VA | |
| E-mail address: | hopson_1@yahoo.com |
Click here for more information about our publications!
PRINT THIS ARTICLE

Request Information From Our Sponsors
- StockCharts.com, Inc.
- Candle Patterns
- Candlestick Charting Explained
- Intermarket Technical Analysis
- John Murphy on Chart Analysis
- John Murphy's Chart Pattern Recognition
- John Murphy's Market Message
- MurphyExplainsMarketAnalysis-Intermarket Analysis
- MurphyExplainsMarketAnalysis-Visual Analysis
- StockCharts.com
- Technical Analysis of the Financial Markets
- The Visual Investor
- VectorVest, Inc.
- Executive Premier Workshop
- One-Day Options Course
- OptionsPro
- Retirement Income Workshop
- Sure-Fire Trading Systems (VectorVest, Inc.)
- Trading as a Business Workshop
- VectorVest 7 EOD
- VectorVest 7 RealTime/IntraDay
- VectorVest AutoTester
- VectorVest Educational Services
- VectorVest OnLine
- VectorVest Options Analyzer
- VectorVest ProGraphics v6.0
- VectorVest ProTrader 7
- VectorVest RealTime Derby Tool
- VectorVest Simulator
- VectorVest Variator
- VectorVest Watchdog
