HOT TOPICS LIST
- MACD
- Fibonacci
- RSI
- Gann
- ADXR
- Stochastics
- Volume
- Triangles
- Futures
- Cycles
- Volatility
- ZIGZAG
- MESA
- Retracement
- Aroon
INDICATORS LIST
LIST OF TOPICS
PRINT THIS ARTICLE
by Koos van der Merwe
Bombardier, Inc. is a manufacturer of business jets, regional aircraft, rail transportation equipment and motorized recreational products. In Canada it is considered a blue chip company, but since 911 it has fallen on hard times as the purchase of aircraft worldwide fell.
Position: Sell
Koos van der Merwe
Has been a technical analyst since 1969, and has worked as a futures and options trader with First Financial Futures in Johannesburg, South Africa.
PRINT THIS ARTICLE
HEAD & SHOULDERS
A Double Head And Shoulders For Bombardier?
01/16/04 07:58:02 AMby Koos van der Merwe
Bombardier, Inc. is a manufacturer of business jets, regional aircraft, rail transportation equipment and motorized recreational products. In Canada it is considered a blue chip company, but since 911 it has fallen on hard times as the purchase of aircraft worldwide fell.
Position: Sell
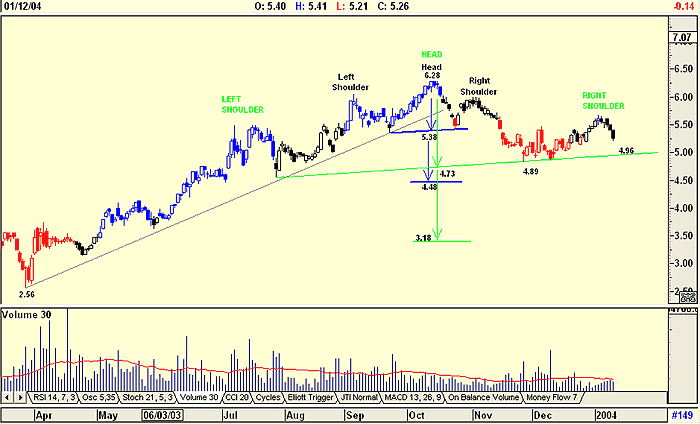
| Paul Tellier was appointed as CEO to lead the company back to "magnificence." What he has achieved is remarkable in the face of world terrorism and competition from other airplane manufacturers, but even he, with his excellent corporate management record, is finding the road ahead tough. The chart below is not a pretty picture and suggests more downside for the company. |

|
| A double head and shoulders pattern. |
| |
| Looking at the chart, Bombardier's price moved up on good volume from the low of $2.56 it reached in March 2003. On October 14 it peaked on falling volume and then formed the right shoulder of a small head and shoulders pattern on even less volume. A head and shoulders pattern is generally regarded as a reversal pattern. The price begins to slow down and the forces of supply and demand are considered to be in balance. Sellers come in at the highs, forming the left shoulder, and the downside is probed at the beginning of the neckline. Buyers soon return to the market and ultimately push through to new highs, forming the head on falling volume -- a sign of weakness. The new highs are quickly turned back and the downside is tested again forming the right shoulder on even less volume, with prices continuing on down to neckline. The point where the neckline is penetrated can be used to calculate a possible downside target. Volume plays an important part in this pattern and is generally higher on the left shoulder than the right shoulder. In the chart, volume on the two left shoulders is far higher than the volume at the head and the two right shoulders. The smaller head and single shoulder pattern gives a target of $4.48 which has not yet been reached. The price found strong support at the neckline of the larger head and double shoulders pattern at $4.89. The price then recovered on even less volume to form the right shoulder of the pattern. |
| Should the price now break below the neckline of the larger pattern at $4.96, I would expect it to fall further to $3.18. Not a happy event -- I would sell Bombardier at these levels. |
Has been a technical analyst since 1969, and has worked as a futures and options trader with First Financial Futures in Johannesburg, South Africa.
| Address: | 3256 West 24th Ave |
| Vancouver, BC | |
| Phone # for sales: | 6042634214 |
| E-mail address: | petroosp@gmail.com |
Click here for more information about our publications!
PRINT THIS ARTICLE

Request Information From Our Sponsors
- VectorVest, Inc.
- Executive Premier Workshop
- One-Day Options Course
- OptionsPro
- Retirement Income Workshop
- Sure-Fire Trading Systems (VectorVest, Inc.)
- Trading as a Business Workshop
- VectorVest 7 EOD
- VectorVest 7 RealTime/IntraDay
- VectorVest AutoTester
- VectorVest Educational Services
- VectorVest OnLine
- VectorVest Options Analyzer
- VectorVest ProGraphics v6.0
- VectorVest ProTrader 7
- VectorVest RealTime Derby Tool
- VectorVest Simulator
- VectorVest Variator
- VectorVest Watchdog
- StockCharts.com, Inc.
- Candle Patterns
- Candlestick Charting Explained
- Intermarket Technical Analysis
- John Murphy on Chart Analysis
- John Murphy's Chart Pattern Recognition
- John Murphy's Market Message
- MurphyExplainsMarketAnalysis-Intermarket Analysis
- MurphyExplainsMarketAnalysis-Visual Analysis
- StockCharts.com
- Technical Analysis of the Financial Markets
- The Visual Investor
